Immigrants from Italy vs Pima Male Unemployment
COMPARE
Immigrants from Italy
Pima
Male Unemployment
Male Unemployment Comparison
Immigrants from Italy
Pima
5.2%
MALE UNEMPLOYMENT
76.3/ 100
METRIC RATING
148th/ 347
METRIC RANK
8.3%
MALE UNEMPLOYMENT
0.0/ 100
METRIC RATING
332nd/ 347
METRIC RANK
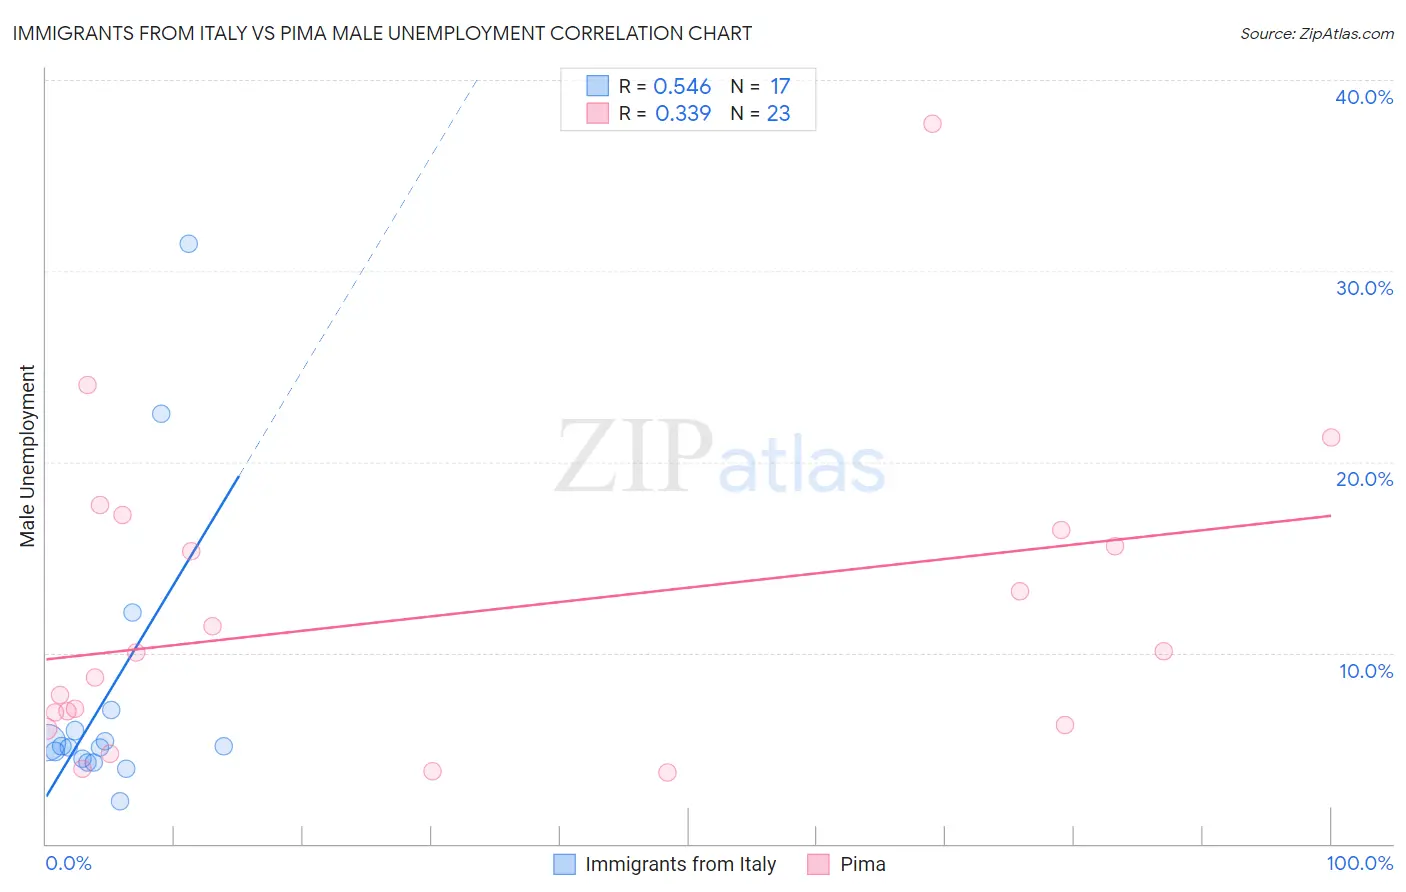
Immigrants from Italy vs Pima Male Unemployment Correlation Chart
The statistical analysis conducted on geographies consisting of 323,258,281 people shows a substantial positive correlation between the proportion of Immigrants from Italy and unemployment rate among males in the United States with a correlation coefficient (R) of 0.546 and weighted average of 5.2%. Similarly, the statistical analysis conducted on geographies consisting of 61,468,646 people shows a mild positive correlation between the proportion of Pima and unemployment rate among males in the United States with a correlation coefficient (R) of 0.339 and weighted average of 8.3%, a difference of 58.9%.
Male Unemployment Correlation Summary
| Measurement | Immigrants from Italy | Pima |
| Minimum | 2.2% | 3.7% |
| Maximum | 31.4% | 37.7% |
| Range | 29.2% | 34.0% |
| Mean | 7.9% | 12.0% |
| Median | 5.1% | 10.0% |
| Interquartile 25% (IQ1) | 4.4% | 6.2% |
| Interquartile 75% (IQ3) | 6.5% | 16.4% |
| Interquartile Range (IQR) | 2.1% | 10.2% |
| Standard Deviation (Sample) | 7.6% | 8.1% |
| Standard Deviation (Population) | 7.4% | 7.9% |
Similar Demographics by Male Unemployment
Demographics Similar to Immigrants from Italy by Male Unemployment
In terms of male unemployment, the demographic groups most similar to Immigrants from Italy are Immigrants from Europe (5.2%, a difference of 0.010%), Indian (Asian) (5.2%, a difference of 0.030%), Slovak (5.2%, a difference of 0.060%), Immigrants from Burma/Myanmar (5.2%, a difference of 0.10%), and Immigrants from Kenya (5.2%, a difference of 0.11%).
| Demographics | Rating | Rank | Male Unemployment |
| Immigrants | Switzerland | 79.2 /100 | #141 | Good 5.2% |
| Fijians | 78.3 /100 | #142 | Good 5.2% |
| Syrians | 78.0 /100 | #143 | Good 5.2% |
| Sri Lankans | 77.9 /100 | #144 | Good 5.2% |
| Macedonians | 77.7 /100 | #145 | Good 5.2% |
| Immigrants | Kenya | 77.6 /100 | #146 | Good 5.2% |
| Immigrants | Burma/Myanmar | 77.5 /100 | #147 | Good 5.2% |
| Immigrants | Italy | 76.3 /100 | #148 | Good 5.2% |
| Immigrants | Europe | 76.2 /100 | #149 | Good 5.2% |
| Indians (Asian) | 76.0 /100 | #150 | Good 5.2% |
| Slovaks | 75.5 /100 | #151 | Good 5.2% |
| Egyptians | 74.8 /100 | #152 | Good 5.2% |
| Immigrants | Uruguay | 73.9 /100 | #153 | Good 5.2% |
| Laotians | 73.8 /100 | #154 | Good 5.2% |
| Immigrants | Hungary | 73.4 /100 | #155 | Good 5.2% |
Demographics Similar to Pima by Male Unemployment
In terms of male unemployment, the demographic groups most similar to Pima are Sioux (8.4%, a difference of 1.3%), Tsimshian (8.5%, a difference of 2.3%), Alaska Native (8.1%, a difference of 2.4%), Pueblo (8.5%, a difference of 2.4%), and Yuman (8.6%, a difference of 3.8%).
| Demographics | Rating | Rank | Male Unemployment |
| Shoshone | 0.0 /100 | #325 | Tragic 7.6% |
| Immigrants | Dominican Republic | 0.0 /100 | #326 | Tragic 7.6% |
| Paiute | 0.0 /100 | #327 | Tragic 7.7% |
| Natives/Alaskans | 0.0 /100 | #328 | Tragic 7.7% |
| Immigrants | Yemen | 0.0 /100 | #329 | Tragic 7.8% |
| Yakama | 0.0 /100 | #330 | Tragic 7.9% |
| Alaska Natives | 0.0 /100 | #331 | Tragic 8.1% |
| Pima | 0.0 /100 | #332 | Tragic 8.3% |
| Sioux | 0.0 /100 | #333 | Tragic 8.4% |
| Tsimshian | 0.0 /100 | #334 | Tragic 8.5% |
| Pueblo | 0.0 /100 | #335 | Tragic 8.5% |
| Yuman | 0.0 /100 | #336 | Tragic 8.6% |
| Puerto Ricans | 0.0 /100 | #337 | Tragic 8.6% |
| Apache | 0.0 /100 | #338 | Tragic 8.6% |
| Cheyenne | 0.0 /100 | #339 | Tragic 9.8% |