Immigrants from Hong Kong vs Immigrants from Eastern Europe Unemployment Among Women with Children Under 18 years
COMPARE
Immigrants from Hong Kong
Immigrants from Eastern Europe
Unemployment Among Women with Children Under 18 years
Unemployment Among Women with Children Under 18 years Comparison
Immigrants from Hong Kong
Immigrants from Eastern Europe
4.7%
UNEMPLOYMENT AMONG WOMEN WITH CHILDREN UNDER 18 YEARS
100.0/ 100
METRIC RATING
8th/ 347
METRIC RANK
5.2%
UNEMPLOYMENT AMONG WOMEN WITH CHILDREN UNDER 18 YEARS
88.5/ 100
METRIC RATING
112th/ 347
METRIC RANK
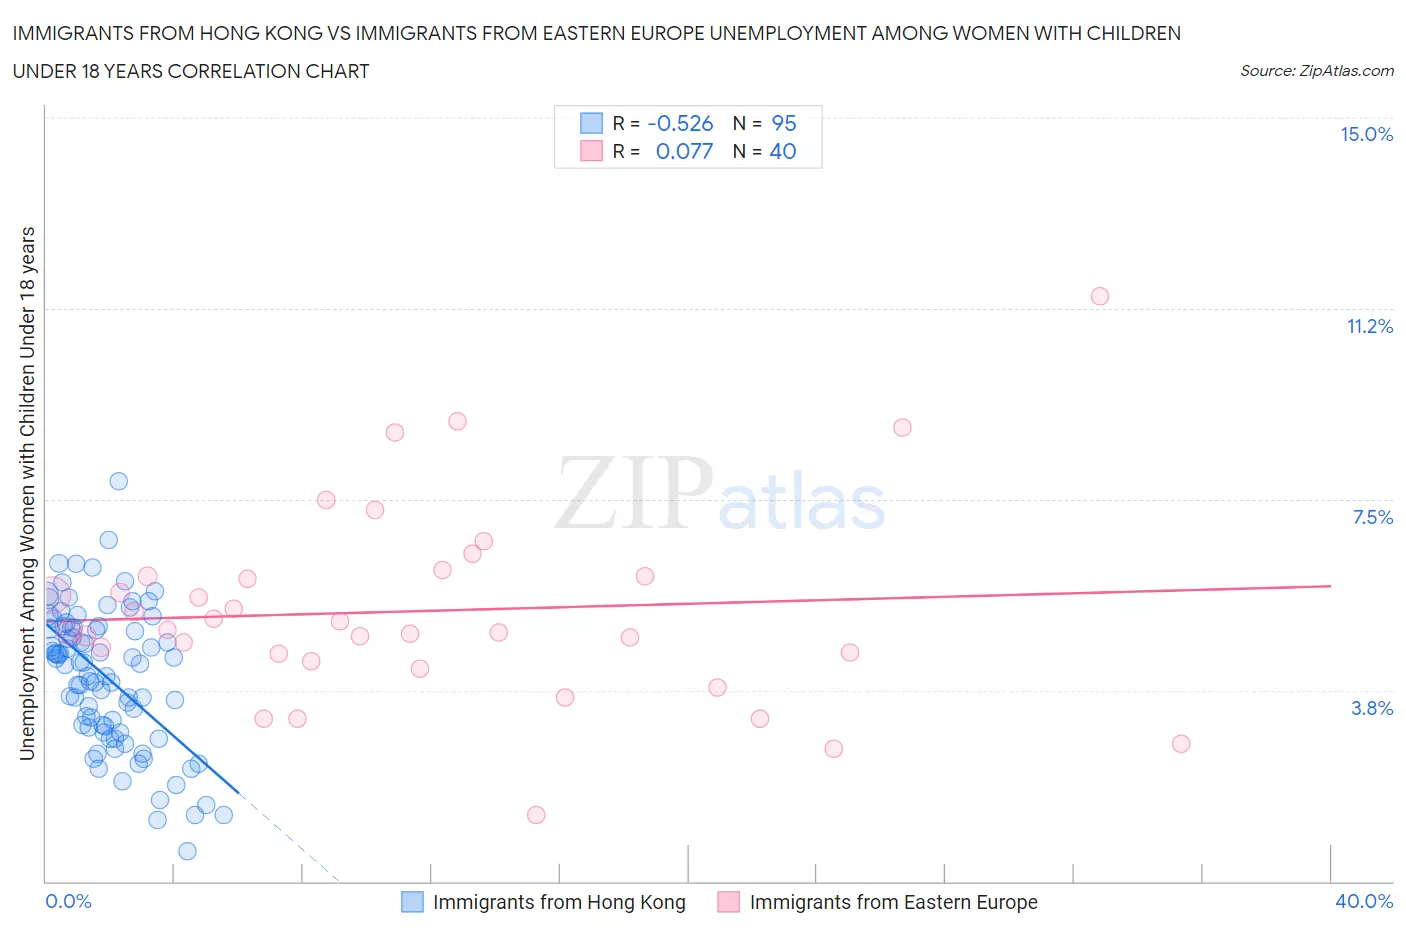
Immigrants from Hong Kong vs Immigrants from Eastern Europe Unemployment Among Women with Children Under 18 years Correlation Chart
The statistical analysis conducted on geographies consisting of 248,601,917 people shows a substantial negative correlation between the proportion of Immigrants from Hong Kong and unemployment rate among women with children under the age of 18 in the United States with a correlation coefficient (R) of -0.526 and weighted average of 4.7%. Similarly, the statistical analysis conducted on geographies consisting of 448,229,094 people shows a slight positive correlation between the proportion of Immigrants from Eastern Europe and unemployment rate among women with children under the age of 18 in the United States with a correlation coefficient (R) of 0.077 and weighted average of 5.2%, a difference of 11.9%.
Unemployment Among Women with Children Under 18 years Correlation Summary
| Measurement | Immigrants from Hong Kong | Immigrants from Eastern Europe |
| Minimum | 0.60% | 1.3% |
| Maximum | 7.9% | 11.5% |
| Range | 7.3% | 10.2% |
| Mean | 4.0% | 5.3% |
| Median | 4.3% | 4.9% |
| Interquartile 25% (IQ1) | 3.0% | 4.4% |
| Interquartile 75% (IQ3) | 5.0% | 6.0% |
| Interquartile Range (IQR) | 2.0% | 1.6% |
| Standard Deviation (Sample) | 1.4% | 1.9% |
| Standard Deviation (Population) | 1.4% | 1.9% |
Similar Demographics by Unemployment Among Women with Children Under 18 years
Demographics Similar to Immigrants from Hong Kong by Unemployment Among Women with Children Under 18 years
In terms of unemployment among women with children under 18 years, the demographic groups most similar to Immigrants from Hong Kong are Immigrants from India (4.7%, a difference of 0.42%), Immigrants from Taiwan (4.7%, a difference of 0.53%), Tongan (4.7%, a difference of 0.63%), Swedish (4.7%, a difference of 0.69%), and Okinawan (4.7%, a difference of 0.84%).
| Demographics | Rating | Rank | Unemployment Among Women with Children Under 18 years |
| Norwegians | 100.0 /100 | #1 | Exceptional 4.4% |
| Hmong | 100.0 /100 | #2 | Exceptional 4.5% |
| Danes | 100.0 /100 | #3 | Exceptional 4.5% |
| Swedes | 100.0 /100 | #4 | Exceptional 4.7% |
| Tongans | 100.0 /100 | #5 | Exceptional 4.7% |
| Immigrants | Taiwan | 100.0 /100 | #6 | Exceptional 4.7% |
| Immigrants | India | 100.0 /100 | #7 | Exceptional 4.7% |
| Immigrants | Hong Kong | 100.0 /100 | #8 | Exceptional 4.7% |
| Okinawans | 99.9 /100 | #9 | Exceptional 4.7% |
| Czechs | 99.9 /100 | #10 | Exceptional 4.7% |
| Filipinos | 99.9 /100 | #11 | Exceptional 4.8% |
| Scandinavians | 99.9 /100 | #12 | Exceptional 4.8% |
| Bulgarians | 99.9 /100 | #13 | Exceptional 4.8% |
| Cambodians | 99.9 /100 | #14 | Exceptional 4.8% |
| Thais | 99.8 /100 | #15 | Exceptional 4.8% |
Demographics Similar to Immigrants from Eastern Europe by Unemployment Among Women with Children Under 18 years
In terms of unemployment among women with children under 18 years, the demographic groups most similar to Immigrants from Eastern Europe are French (5.2%, a difference of 0.010%), Kenyan (5.3%, a difference of 0.050%), Immigrants from Czechoslovakia (5.2%, a difference of 0.070%), French Canadian (5.2%, a difference of 0.070%), and Hungarian (5.3%, a difference of 0.070%).
| Demographics | Rating | Rank | Unemployment Among Women with Children Under 18 years |
| Immigrants | France | 90.0 /100 | #105 | Excellent 5.2% |
| Pakistanis | 89.9 /100 | #106 | Excellent 5.2% |
| Slavs | 89.8 /100 | #107 | Excellent 5.2% |
| Iranians | 89.7 /100 | #108 | Excellent 5.2% |
| Immigrants | Russia | 89.0 /100 | #109 | Excellent 5.2% |
| Immigrants | Czechoslovakia | 88.9 /100 | #110 | Excellent 5.2% |
| French Canadians | 88.9 /100 | #111 | Excellent 5.2% |
| Immigrants | Eastern Europe | 88.5 /100 | #112 | Excellent 5.2% |
| French | 88.4 /100 | #113 | Excellent 5.2% |
| Kenyans | 88.2 /100 | #114 | Excellent 5.3% |
| Hungarians | 88.1 /100 | #115 | Excellent 5.3% |
| Macedonians | 87.7 /100 | #116 | Excellent 5.3% |
| Canadians | 87.4 /100 | #117 | Excellent 5.3% |
| Immigrants | Europe | 86.7 /100 | #118 | Excellent 5.3% |
| Basques | 86.5 /100 | #119 | Excellent 5.3% |