Immigrants from Honduras vs Norwegian Unemployment Among Women with Children Under 6 years
COMPARE
Immigrants from Honduras
Norwegian
Unemployment Among Women with Children Under 6 years
Unemployment Among Women with Children Under 6 years Comparison
Immigrants from Honduras
Norwegians
8.4%
UNEMPLOYMENT AMONG WOMEN WITH CHILDREN UNDER 6 YEARS
0.3/ 100
METRIC RATING
266th/ 347
METRIC RANK
7.2%
UNEMPLOYMENT AMONG WOMEN WITH CHILDREN UNDER 6 YEARS
96.7/ 100
METRIC RATING
111th/ 347
METRIC RANK
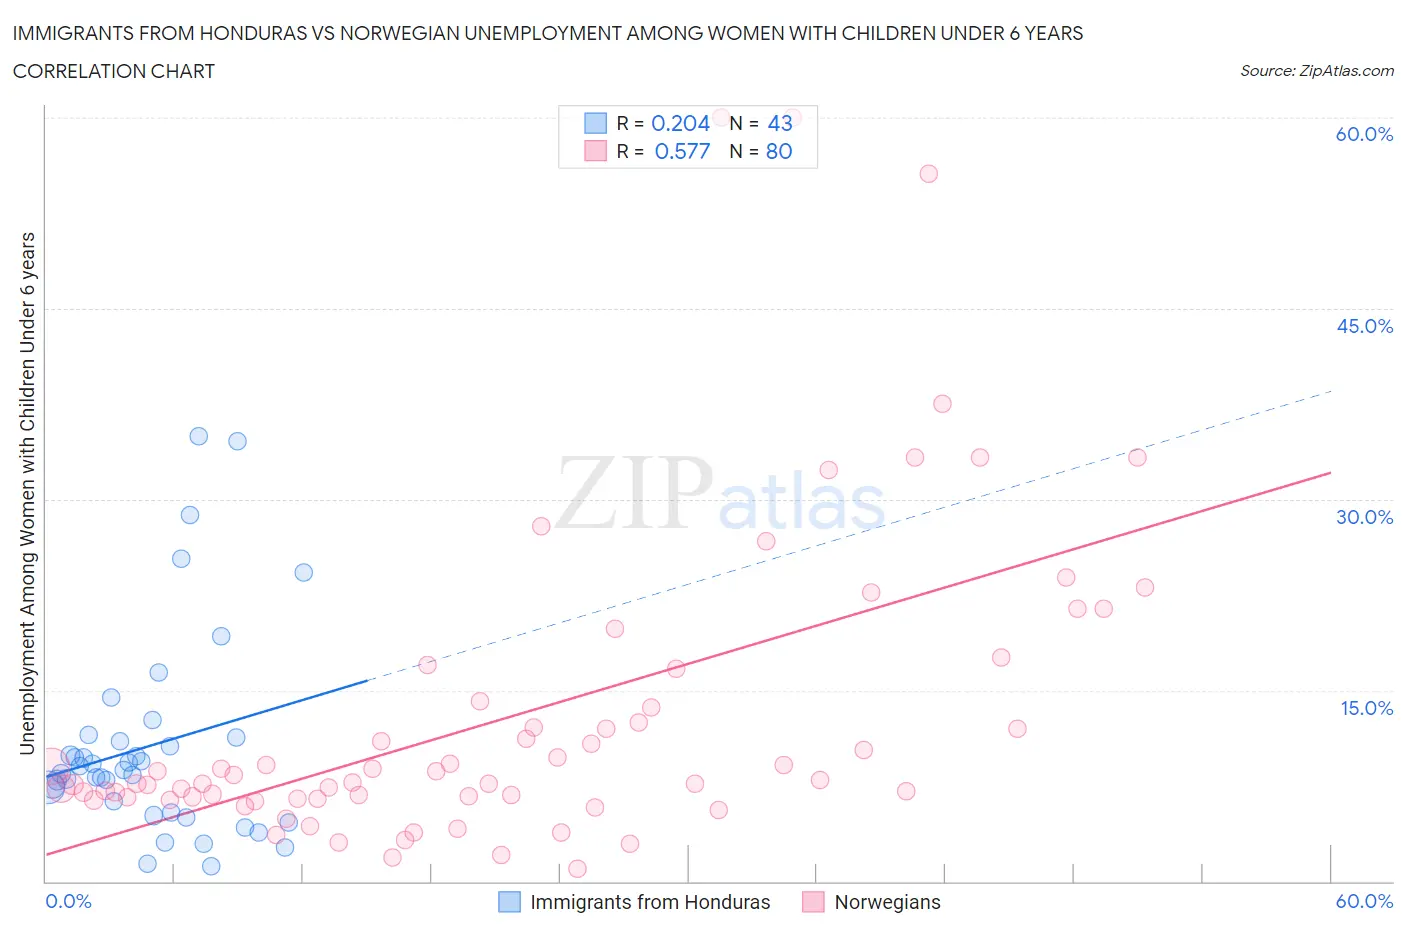
Immigrants from Honduras vs Norwegian Unemployment Among Women with Children Under 6 years Correlation Chart
The statistical analysis conducted on geographies consisting of 261,485,985 people shows a weak positive correlation between the proportion of Immigrants from Honduras and unemployment rate among women with children under the age of 6 in the United States with a correlation coefficient (R) of 0.204 and weighted average of 8.4%. Similarly, the statistical analysis conducted on geographies consisting of 360,664,498 people shows a substantial positive correlation between the proportion of Norwegians and unemployment rate among women with children under the age of 6 in the United States with a correlation coefficient (R) of 0.577 and weighted average of 7.2%, a difference of 16.4%.
Unemployment Among Women with Children Under 6 years Correlation Summary
| Measurement | Immigrants from Honduras | Norwegian |
| Minimum | 1.2% | 1.0% |
| Maximum | 35.0% | 60.0% |
| Range | 33.8% | 59.0% |
| Mean | 10.6% | 12.9% |
| Median | 8.8% | 7.8% |
| Interquartile 25% (IQ1) | 5.4% | 6.5% |
| Interquartile 75% (IQ3) | 11.3% | 13.9% |
| Interquartile Range (IQR) | 5.9% | 7.3% |
| Standard Deviation (Sample) | 8.0% | 12.2% |
| Standard Deviation (Population) | 7.9% | 12.2% |
Similar Demographics by Unemployment Among Women with Children Under 6 years
Demographics Similar to Immigrants from Honduras by Unemployment Among Women with Children Under 6 years
In terms of unemployment among women with children under 6 years, the demographic groups most similar to Immigrants from Honduras are French Canadian (8.4%, a difference of 0.0%), Honduran (8.4%, a difference of 0.050%), Scotch-Irish (8.4%, a difference of 0.070%), West Indian (8.4%, a difference of 0.11%), and Immigrants from Liberia (8.4%, a difference of 0.12%).
| Demographics | Rating | Rank | Unemployment Among Women with Children Under 6 years |
| Barbadians | 0.4 /100 | #259 | Tragic 8.3% |
| Whites/Caucasians | 0.3 /100 | #260 | Tragic 8.4% |
| Immigrants | Liberia | 0.3 /100 | #261 | Tragic 8.4% |
| West Indians | 0.3 /100 | #262 | Tragic 8.4% |
| Scotch-Irish | 0.3 /100 | #263 | Tragic 8.4% |
| Hondurans | 0.3 /100 | #264 | Tragic 8.4% |
| French Canadians | 0.3 /100 | #265 | Tragic 8.4% |
| Immigrants | Honduras | 0.3 /100 | #266 | Tragic 8.4% |
| Belizeans | 0.2 /100 | #267 | Tragic 8.4% |
| Sub-Saharan Africans | 0.2 /100 | #268 | Tragic 8.4% |
| Immigrants | Haiti | 0.2 /100 | #269 | Tragic 8.4% |
| Immigrants | Senegal | 0.2 /100 | #270 | Tragic 8.5% |
| Immigrants | Congo | 0.2 /100 | #271 | Tragic 8.5% |
| Mexican American Indians | 0.1 /100 | #272 | Tragic 8.5% |
| Slovaks | 0.1 /100 | #273 | Tragic 8.5% |
Demographics Similar to Norwegians by Unemployment Among Women with Children Under 6 years
In terms of unemployment among women with children under 6 years, the demographic groups most similar to Norwegians are Palestinian (7.2%, a difference of 0.060%), Israeli (7.2%, a difference of 0.11%), Eastern European (7.2%, a difference of 0.13%), Australian (7.2%, a difference of 0.13%), and Nicaraguan (7.2%, a difference of 0.19%).
| Demographics | Rating | Rank | Unemployment Among Women with Children Under 6 years |
| Immigrants | Egypt | 97.2 /100 | #104 | Exceptional 7.2% |
| Venezuelans | 97.2 /100 | #105 | Exceptional 7.2% |
| Immigrants | Pakistan | 97.2 /100 | #106 | Exceptional 7.2% |
| Immigrants | Kazakhstan | 97.1 /100 | #107 | Exceptional 7.2% |
| Eastern Europeans | 96.9 /100 | #108 | Exceptional 7.2% |
| Australians | 96.9 /100 | #109 | Exceptional 7.2% |
| Palestinians | 96.8 /100 | #110 | Exceptional 7.2% |
| Norwegians | 96.7 /100 | #111 | Exceptional 7.2% |
| Israelis | 96.5 /100 | #112 | Exceptional 7.2% |
| Nicaraguans | 96.3 /100 | #113 | Exceptional 7.2% |
| Argentineans | 96.2 /100 | #114 | Exceptional 7.2% |
| Immigrants | Italy | 96.1 /100 | #115 | Exceptional 7.2% |
| Armenians | 95.9 /100 | #116 | Exceptional 7.2% |
| Immigrants | Kenya | 95.4 /100 | #117 | Exceptional 7.3% |
| Serbians | 94.5 /100 | #118 | Exceptional 7.3% |