Immigrants from Haiti vs Immigrants from Moldova Male Unemployment
COMPARE
Immigrants from Haiti
Immigrants from Moldova
Male Unemployment
Male Unemployment Comparison
Immigrants from Haiti
Immigrants from Moldova
6.5%
MALE UNEMPLOYMENT
0.0/ 100
METRIC RATING
296th/ 347
METRIC RANK
5.1%
MALE UNEMPLOYMENT
90.3/ 100
METRIC RATING
112th/ 347
METRIC RANK
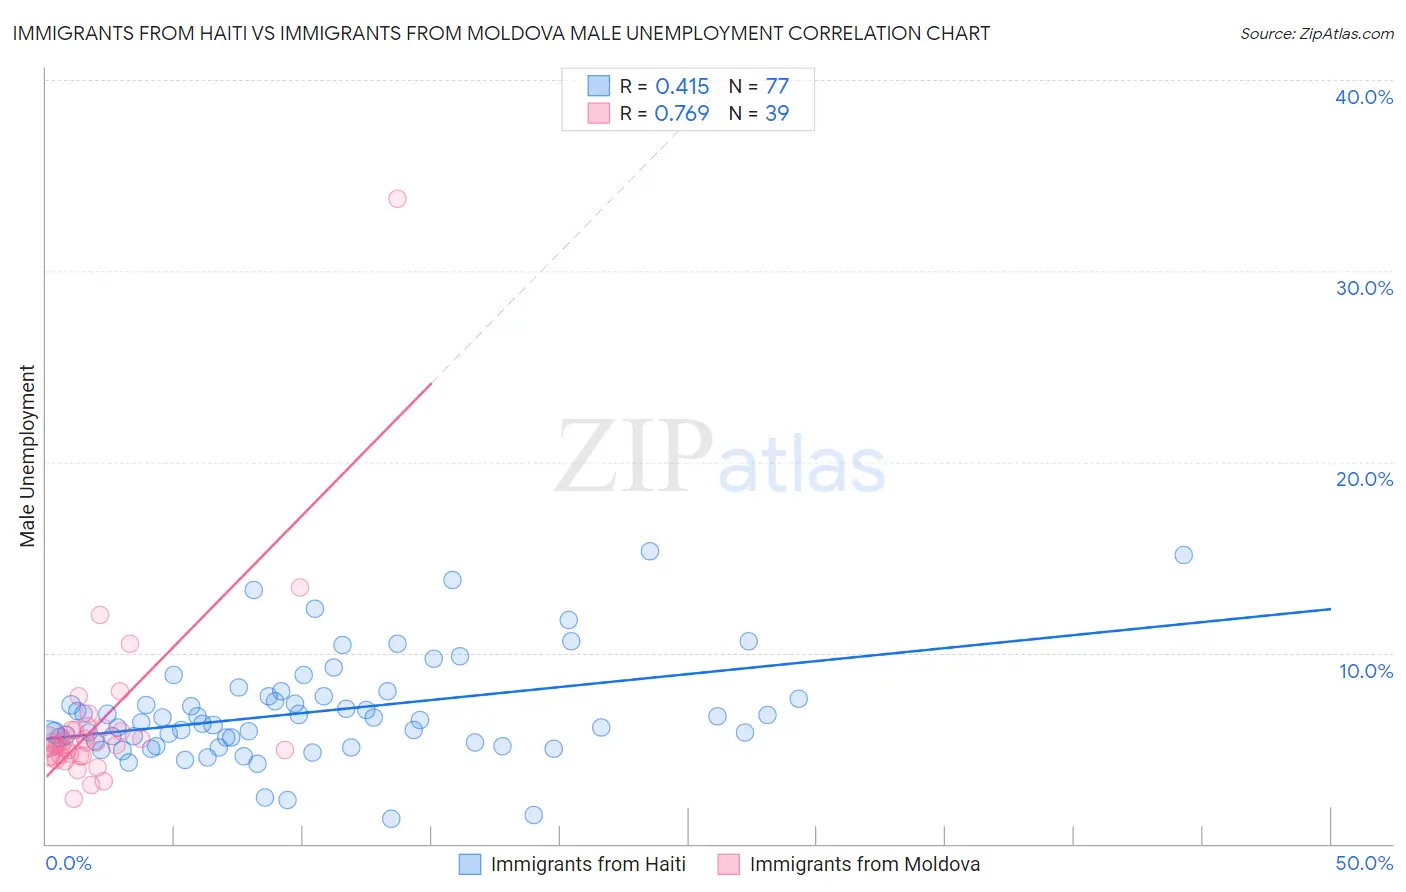
Immigrants from Haiti vs Immigrants from Moldova Male Unemployment Correlation Chart
The statistical analysis conducted on geographies consisting of 224,769,713 people shows a moderate positive correlation between the proportion of Immigrants from Haiti and unemployment rate among males in the United States with a correlation coefficient (R) of 0.415 and weighted average of 6.5%. Similarly, the statistical analysis conducted on geographies consisting of 124,231,836 people shows a strong positive correlation between the proportion of Immigrants from Moldova and unemployment rate among males in the United States with a correlation coefficient (R) of 0.769 and weighted average of 5.1%, a difference of 27.5%.
Male Unemployment Correlation Summary
| Measurement | Immigrants from Haiti | Immigrants from Moldova |
| Minimum | 1.3% | 2.4% |
| Maximum | 15.3% | 33.8% |
| Range | 14.0% | 31.4% |
| Mean | 6.9% | 6.4% |
| Median | 6.3% | 5.3% |
| Interquartile 25% (IQ1) | 5.3% | 4.6% |
| Interquartile 75% (IQ3) | 7.7% | 6.0% |
| Interquartile Range (IQR) | 2.4% | 1.4% |
| Standard Deviation (Sample) | 2.7% | 5.0% |
| Standard Deviation (Population) | 2.7% | 4.9% |
Similar Demographics by Male Unemployment
Demographics Similar to Immigrants from Haiti by Male Unemployment
In terms of male unemployment, the demographic groups most similar to Immigrants from Haiti are Chippewa (6.6%, a difference of 0.32%), Jamaican (6.6%, a difference of 0.40%), Belizean (6.5%, a difference of 0.45%), Immigrants from Bangladesh (6.6%, a difference of 0.53%), and Vietnamese (6.6%, a difference of 0.80%).
| Demographics | Rating | Rank | Male Unemployment |
| Immigrants | Caribbean | 0.0 /100 | #289 | Tragic 6.3% |
| U.S. Virgin Islanders | 0.0 /100 | #290 | Tragic 6.4% |
| Immigrants | Azores | 0.0 /100 | #291 | Tragic 6.4% |
| Nepalese | 0.0 /100 | #292 | Tragic 6.4% |
| Haitians | 0.0 /100 | #293 | Tragic 6.4% |
| Senegalese | 0.0 /100 | #294 | Tragic 6.4% |
| Belizeans | 0.0 /100 | #295 | Tragic 6.5% |
| Immigrants | Haiti | 0.0 /100 | #296 | Tragic 6.5% |
| Chippewa | 0.0 /100 | #297 | Tragic 6.6% |
| Jamaicans | 0.0 /100 | #298 | Tragic 6.6% |
| Immigrants | Bangladesh | 0.0 /100 | #299 | Tragic 6.6% |
| Vietnamese | 0.0 /100 | #300 | Tragic 6.6% |
| Immigrants | Belize | 0.0 /100 | #301 | Tragic 6.6% |
| Ute | 0.0 /100 | #302 | Tragic 6.6% |
| Immigrants | West Indies | 0.0 /100 | #303 | Tragic 6.7% |
Demographics Similar to Immigrants from Moldova by Male Unemployment
In terms of male unemployment, the demographic groups most similar to Immigrants from Moldova are Immigrants from Austria (5.1%, a difference of 0.010%), Immigrants from Eastern Asia (5.1%, a difference of 0.080%), Romanian (5.1%, a difference of 0.080%), Immigrants from England (5.1%, a difference of 0.090%), and Immigrants from Pakistan (5.1%, a difference of 0.11%).
| Demographics | Rating | Rank | Male Unemployment |
| Immigrants | Czechoslovakia | 91.7 /100 | #105 | Exceptional 5.1% |
| Immigrants | Ethiopia | 91.5 /100 | #106 | Exceptional 5.1% |
| Ethiopians | 91.3 /100 | #107 | Exceptional 5.1% |
| Immigrants | Nicaragua | 91.2 /100 | #108 | Exceptional 5.1% |
| Immigrants | Pakistan | 90.9 /100 | #109 | Exceptional 5.1% |
| Immigrants | England | 90.8 /100 | #110 | Exceptional 5.1% |
| Immigrants | Eastern Asia | 90.8 /100 | #111 | Exceptional 5.1% |
| Immigrants | Moldova | 90.3 /100 | #112 | Exceptional 5.1% |
| Immigrants | Austria | 90.3 /100 | #113 | Exceptional 5.1% |
| Romanians | 89.8 /100 | #114 | Excellent 5.1% |
| Immigrants | Asia | 89.6 /100 | #115 | Excellent 5.1% |
| Immigrants | Denmark | 89.4 /100 | #116 | Excellent 5.1% |
| Estonians | 89.0 /100 | #117 | Excellent 5.1% |
| Cypriots | 88.8 /100 | #118 | Excellent 5.1% |
| French Canadians | 88.6 /100 | #119 | Excellent 5.1% |