Immigrants from Haiti vs Bhutanese Male Unemployment
COMPARE
Immigrants from Haiti
Bhutanese
Male Unemployment
Male Unemployment Comparison
Immigrants from Haiti
Bhutanese
6.5%
MALE UNEMPLOYMENT
0.0/ 100
METRIC RATING
296th/ 347
METRIC RANK
4.9%
MALE UNEMPLOYMENT
98.9/ 100
METRIC RATING
46th/ 347
METRIC RANK
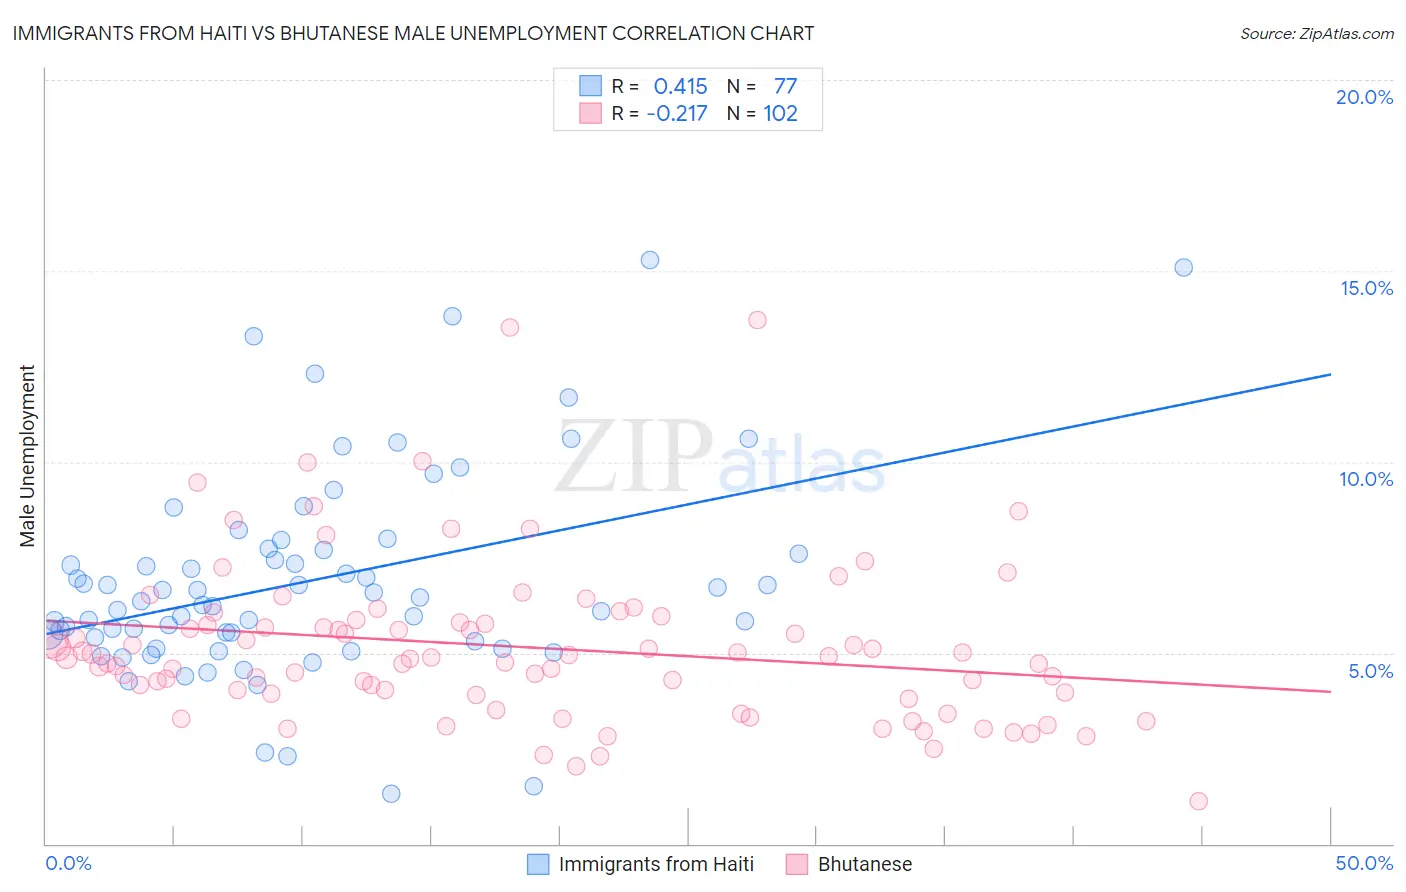
Immigrants from Haiti vs Bhutanese Male Unemployment Correlation Chart
The statistical analysis conducted on geographies consisting of 224,769,713 people shows a moderate positive correlation between the proportion of Immigrants from Haiti and unemployment rate among males in the United States with a correlation coefficient (R) of 0.415 and weighted average of 6.5%. Similarly, the statistical analysis conducted on geographies consisting of 452,760,879 people shows a weak negative correlation between the proportion of Bhutanese and unemployment rate among males in the United States with a correlation coefficient (R) of -0.217 and weighted average of 4.9%, a difference of 32.1%.
Male Unemployment Correlation Summary
| Measurement | Immigrants from Haiti | Bhutanese |
| Minimum | 1.3% | 1.1% |
| Maximum | 15.3% | 13.7% |
| Range | 14.0% | 12.6% |
| Mean | 6.9% | 5.2% |
| Median | 6.3% | 4.9% |
| Interquartile 25% (IQ1) | 5.3% | 3.9% |
| Interquartile 75% (IQ3) | 7.7% | 5.8% |
| Interquartile Range (IQR) | 2.4% | 1.9% |
| Standard Deviation (Sample) | 2.7% | 2.1% |
| Standard Deviation (Population) | 2.7% | 2.1% |
Similar Demographics by Male Unemployment
Demographics Similar to Immigrants from Haiti by Male Unemployment
In terms of male unemployment, the demographic groups most similar to Immigrants from Haiti are Chippewa (6.6%, a difference of 0.32%), Jamaican (6.6%, a difference of 0.40%), Belizean (6.5%, a difference of 0.45%), Immigrants from Bangladesh (6.6%, a difference of 0.53%), and Vietnamese (6.6%, a difference of 0.80%).
| Demographics | Rating | Rank | Male Unemployment |
| Immigrants | Caribbean | 0.0 /100 | #289 | Tragic 6.3% |
| U.S. Virgin Islanders | 0.0 /100 | #290 | Tragic 6.4% |
| Immigrants | Azores | 0.0 /100 | #291 | Tragic 6.4% |
| Nepalese | 0.0 /100 | #292 | Tragic 6.4% |
| Haitians | 0.0 /100 | #293 | Tragic 6.4% |
| Senegalese | 0.0 /100 | #294 | Tragic 6.4% |
| Belizeans | 0.0 /100 | #295 | Tragic 6.5% |
| Immigrants | Haiti | 0.0 /100 | #296 | Tragic 6.5% |
| Chippewa | 0.0 /100 | #297 | Tragic 6.6% |
| Jamaicans | 0.0 /100 | #298 | Tragic 6.6% |
| Immigrants | Bangladesh | 0.0 /100 | #299 | Tragic 6.6% |
| Vietnamese | 0.0 /100 | #300 | Tragic 6.6% |
| Immigrants | Belize | 0.0 /100 | #301 | Tragic 6.6% |
| Ute | 0.0 /100 | #302 | Tragic 6.6% |
| Immigrants | West Indies | 0.0 /100 | #303 | Tragic 6.7% |
Demographics Similar to Bhutanese by Male Unemployment
In terms of male unemployment, the demographic groups most similar to Bhutanese are Austrian (4.9%, a difference of 0.070%), Immigrants from Zimbabwe (4.9%, a difference of 0.090%), Immigrants from Scotland (4.9%, a difference of 0.090%), Polish (4.9%, a difference of 0.10%), and Croatian (4.9%, a difference of 0.11%).
| Demographics | Rating | Rank | Male Unemployment |
| Burmese | 99.3 /100 | #39 | Exceptional 4.9% |
| Northern Europeans | 99.3 /100 | #40 | Exceptional 4.9% |
| Chinese | 99.3 /100 | #41 | Exceptional 4.9% |
| Immigrants | Belgium | 99.2 /100 | #42 | Exceptional 4.9% |
| Immigrants | Japan | 99.2 /100 | #43 | Exceptional 4.9% |
| Immigrants | Korea | 99.1 /100 | #44 | Exceptional 4.9% |
| Immigrants | Zimbabwe | 99.0 /100 | #45 | Exceptional 4.9% |
| Bhutanese | 98.9 /100 | #46 | Exceptional 4.9% |
| Austrians | 98.9 /100 | #47 | Exceptional 4.9% |
| Immigrants | Scotland | 98.9 /100 | #48 | Exceptional 4.9% |
| Poles | 98.9 /100 | #49 | Exceptional 4.9% |
| Croatians | 98.9 /100 | #50 | Exceptional 4.9% |
| Slovenes | 98.8 /100 | #51 | Exceptional 5.0% |
| Irish | 98.8 /100 | #52 | Exceptional 5.0% |
| Jordanians | 98.8 /100 | #53 | Exceptional 5.0% |