Immigrants from Bahamas vs Bhutanese Male Unemployment
COMPARE
Immigrants from Bahamas
Bhutanese
Male Unemployment
Male Unemployment Comparison
Immigrants from Bahamas
Bhutanese
5.7%
MALE UNEMPLOYMENT
0.4/ 100
METRIC RATING
250th/ 347
METRIC RANK
4.9%
MALE UNEMPLOYMENT
98.9/ 100
METRIC RATING
46th/ 347
METRIC RANK
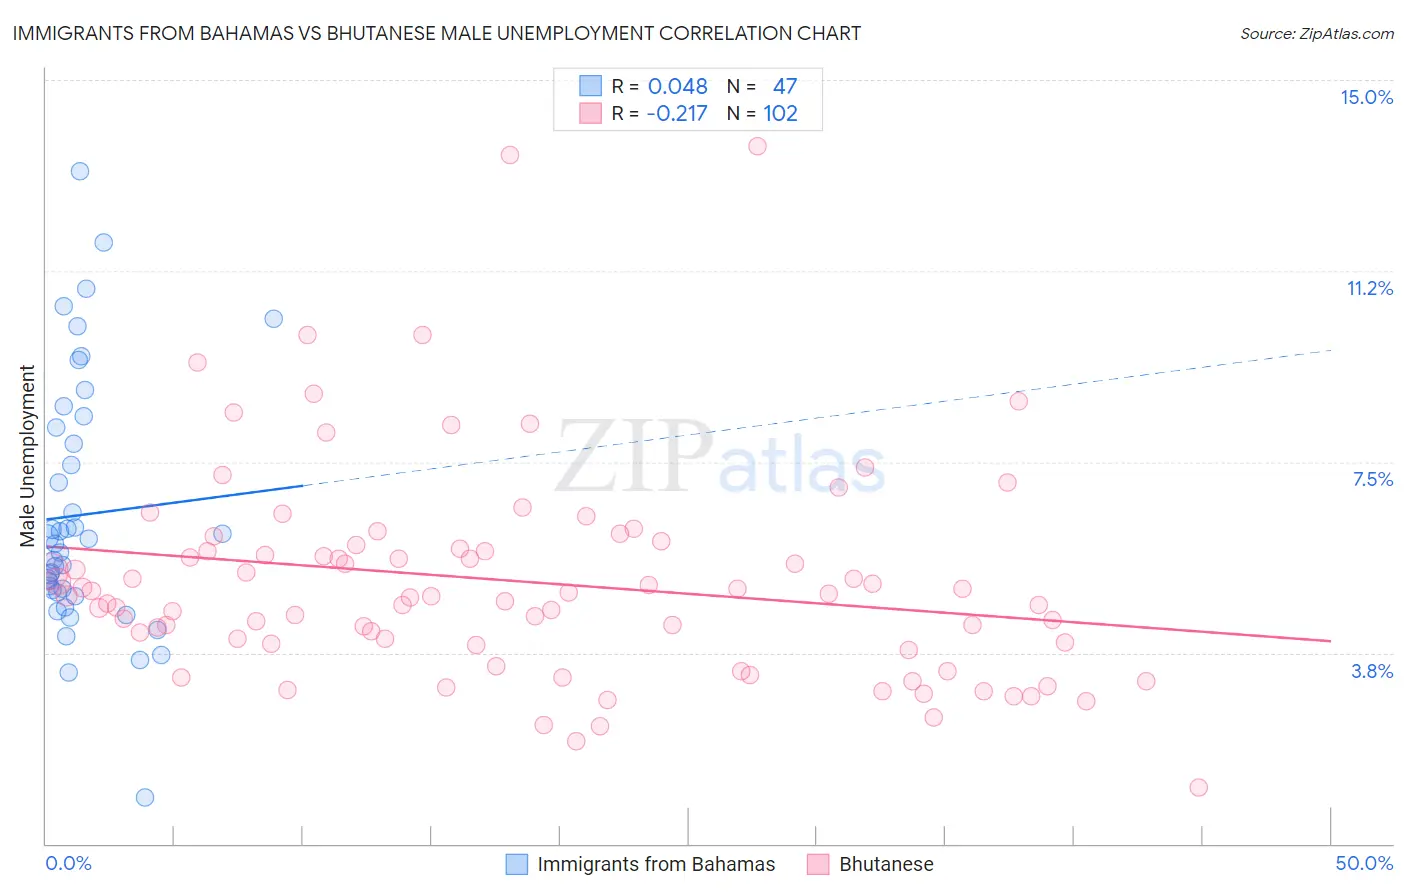
Immigrants from Bahamas vs Bhutanese Male Unemployment Correlation Chart
The statistical analysis conducted on geographies consisting of 104,587,349 people shows no correlation between the proportion of Immigrants from Bahamas and unemployment rate among males in the United States with a correlation coefficient (R) of 0.048 and weighted average of 5.7%. Similarly, the statistical analysis conducted on geographies consisting of 452,760,879 people shows a weak negative correlation between the proportion of Bhutanese and unemployment rate among males in the United States with a correlation coefficient (R) of -0.217 and weighted average of 4.9%, a difference of 15.9%.
Male Unemployment Correlation Summary
| Measurement | Immigrants from Bahamas | Bhutanese |
| Minimum | 0.90% | 1.1% |
| Maximum | 13.2% | 13.7% |
| Range | 12.3% | 12.6% |
| Mean | 6.5% | 5.2% |
| Median | 5.9% | 4.9% |
| Interquartile 25% (IQ1) | 4.9% | 3.9% |
| Interquartile 75% (IQ3) | 8.2% | 5.8% |
| Interquartile Range (IQR) | 3.2% | 1.9% |
| Standard Deviation (Sample) | 2.5% | 2.1% |
| Standard Deviation (Population) | 2.4% | 2.1% |
Similar Demographics by Male Unemployment
Demographics Similar to Immigrants from Bahamas by Male Unemployment
In terms of male unemployment, the demographic groups most similar to Immigrants from Bahamas are Spanish American (5.7%, a difference of 0.040%), Cree (5.7%, a difference of 0.24%), Marshallese (5.7%, a difference of 0.31%), Mexican (5.8%, a difference of 0.62%), and Hawaiian (5.7%, a difference of 0.63%).
| Demographics | Rating | Rank | Male Unemployment |
| Bangladeshis | 0.8 /100 | #243 | Tragic 5.7% |
| Immigrants | El Salvador | 0.7 /100 | #244 | Tragic 5.7% |
| Yaqui | 0.7 /100 | #245 | Tragic 5.7% |
| Iroquois | 0.6 /100 | #246 | Tragic 5.7% |
| Hawaiians | 0.6 /100 | #247 | Tragic 5.7% |
| Marshallese | 0.5 /100 | #248 | Tragic 5.7% |
| Cree | 0.4 /100 | #249 | Tragic 5.7% |
| Immigrants | Bahamas | 0.4 /100 | #250 | Tragic 5.7% |
| Spanish Americans | 0.3 /100 | #251 | Tragic 5.7% |
| Mexicans | 0.2 /100 | #252 | Tragic 5.8% |
| Mexican American Indians | 0.2 /100 | #253 | Tragic 5.8% |
| Japanese | 0.2 /100 | #254 | Tragic 5.8% |
| Kiowa | 0.2 /100 | #255 | Tragic 5.8% |
| Comanche | 0.2 /100 | #256 | Tragic 5.8% |
| Hispanics or Latinos | 0.1 /100 | #257 | Tragic 5.8% |
Demographics Similar to Bhutanese by Male Unemployment
In terms of male unemployment, the demographic groups most similar to Bhutanese are Austrian (4.9%, a difference of 0.070%), Immigrants from Zimbabwe (4.9%, a difference of 0.090%), Immigrants from Scotland (4.9%, a difference of 0.090%), Polish (4.9%, a difference of 0.10%), and Croatian (4.9%, a difference of 0.11%).
| Demographics | Rating | Rank | Male Unemployment |
| Burmese | 99.3 /100 | #39 | Exceptional 4.9% |
| Northern Europeans | 99.3 /100 | #40 | Exceptional 4.9% |
| Chinese | 99.3 /100 | #41 | Exceptional 4.9% |
| Immigrants | Belgium | 99.2 /100 | #42 | Exceptional 4.9% |
| Immigrants | Japan | 99.2 /100 | #43 | Exceptional 4.9% |
| Immigrants | Korea | 99.1 /100 | #44 | Exceptional 4.9% |
| Immigrants | Zimbabwe | 99.0 /100 | #45 | Exceptional 4.9% |
| Bhutanese | 98.9 /100 | #46 | Exceptional 4.9% |
| Austrians | 98.9 /100 | #47 | Exceptional 4.9% |
| Immigrants | Scotland | 98.9 /100 | #48 | Exceptional 4.9% |
| Poles | 98.9 /100 | #49 | Exceptional 4.9% |
| Croatians | 98.9 /100 | #50 | Exceptional 4.9% |
| Slovenes | 98.8 /100 | #51 | Exceptional 5.0% |
| Irish | 98.8 /100 | #52 | Exceptional 5.0% |
| Jordanians | 98.8 /100 | #53 | Exceptional 5.0% |