Immigrants from Guatemala vs Palestinian Female Unemployment
COMPARE
Immigrants from Guatemala
Palestinian
Female Unemployment
Female Unemployment Comparison
Immigrants from Guatemala
Palestinians
6.1%
FEMALE UNEMPLOYMENT
0.0/ 100
METRIC RATING
287th/ 347
METRIC RANK
5.1%
FEMALE UNEMPLOYMENT
80.8/ 100
METRIC RATING
142nd/ 347
METRIC RANK
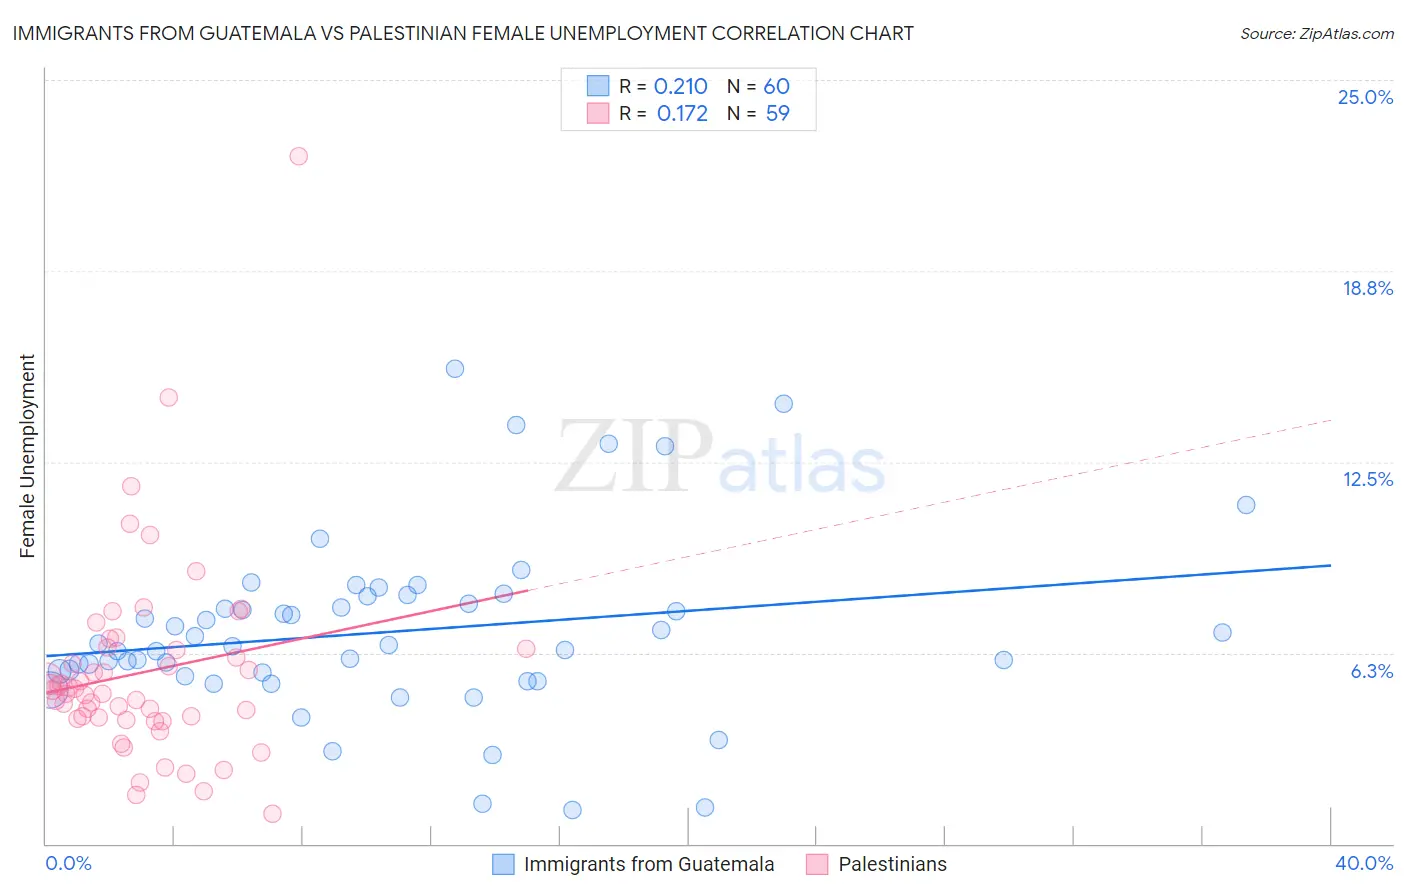
Immigrants from Guatemala vs Palestinian Female Unemployment Correlation Chart
The statistical analysis conducted on geographies consisting of 375,756,424 people shows a weak positive correlation between the proportion of Immigrants from Guatemala and unemploymnet rate among females in the United States with a correlation coefficient (R) of 0.210 and weighted average of 6.1%. Similarly, the statistical analysis conducted on geographies consisting of 216,232,493 people shows a poor positive correlation between the proportion of Palestinians and unemploymnet rate among females in the United States with a correlation coefficient (R) of 0.172 and weighted average of 5.1%, a difference of 18.3%.
Female Unemployment Correlation Summary
| Measurement | Immigrants from Guatemala | Palestinian |
| Minimum | 1.1% | 1.0% |
| Maximum | 15.6% | 22.5% |
| Range | 14.5% | 21.5% |
| Mean | 6.9% | 5.6% |
| Median | 6.5% | 5.0% |
| Interquartile 25% (IQ1) | 5.5% | 4.1% |
| Interquartile 75% (IQ3) | 8.0% | 6.4% |
| Interquartile Range (IQR) | 2.4% | 2.3% |
| Standard Deviation (Sample) | 2.9% | 3.3% |
| Standard Deviation (Population) | 2.9% | 3.3% |
Similar Demographics by Female Unemployment
Demographics Similar to Immigrants from Guatemala by Female Unemployment
In terms of female unemployment, the demographic groups most similar to Immigrants from Guatemala are Chippewa (6.1%, a difference of 0.030%), Haitian (6.1%, a difference of 0.040%), Immigrants from Cabo Verde (6.1%, a difference of 0.050%), Trinidadian and Tobagonian (6.1%, a difference of 0.050%), and Immigrants from Caribbean (6.1%, a difference of 0.11%).
| Demographics | Rating | Rank | Female Unemployment |
| Mexican American Indians | 0.0 /100 | #280 | Tragic 6.0% |
| Guatemalans | 0.0 /100 | #281 | Tragic 6.0% |
| Colville | 0.0 /100 | #282 | Tragic 6.0% |
| Salvadorans | 0.0 /100 | #283 | Tragic 6.0% |
| Immigrants | Senegal | 0.0 /100 | #284 | Tragic 6.1% |
| Immigrants | Cabo Verde | 0.0 /100 | #285 | Tragic 6.1% |
| Chippewa | 0.0 /100 | #286 | Tragic 6.1% |
| Immigrants | Guatemala | 0.0 /100 | #287 | Tragic 6.1% |
| Haitians | 0.0 /100 | #288 | Tragic 6.1% |
| Trinidadians and Tobagonians | 0.0 /100 | #289 | Tragic 6.1% |
| Immigrants | Caribbean | 0.0 /100 | #290 | Tragic 6.1% |
| Immigrants | West Indies | 0.0 /100 | #291 | Tragic 6.1% |
| Immigrants | Trinidad and Tobago | 0.0 /100 | #292 | Tragic 6.1% |
| Mexicans | 0.0 /100 | #293 | Tragic 6.1% |
| Immigrants | El Salvador | 0.0 /100 | #294 | Tragic 6.1% |
Demographics Similar to Palestinians by Female Unemployment
In terms of female unemployment, the demographic groups most similar to Palestinians are Immigrants from Kazakhstan (5.1%, a difference of 0.010%), Immigrants from Jordan (5.1%, a difference of 0.040%), Immigrants from Eastern Europe (5.1%, a difference of 0.080%), Immigrants from Oceania (5.2%, a difference of 0.12%), and Immigrants from Norway (5.2%, a difference of 0.13%).
| Demographics | Rating | Rank | Female Unemployment |
| Immigrants | Latvia | 84.6 /100 | #135 | Excellent 5.1% |
| Indians (Asian) | 84.2 /100 | #136 | Excellent 5.1% |
| Pakistanis | 83.8 /100 | #137 | Excellent 5.1% |
| Chickasaw | 83.2 /100 | #138 | Excellent 5.1% |
| Immigrants | Eastern Asia | 83.0 /100 | #139 | Excellent 5.1% |
| Immigrants | France | 82.7 /100 | #140 | Excellent 5.1% |
| Immigrants | Eastern Europe | 81.5 /100 | #141 | Excellent 5.1% |
| Palestinians | 80.8 /100 | #142 | Excellent 5.1% |
| Immigrants | Kazakhstan | 80.7 /100 | #143 | Excellent 5.1% |
| Immigrants | Jordan | 80.4 /100 | #144 | Excellent 5.1% |
| Immigrants | Oceania | 79.5 /100 | #145 | Good 5.2% |
| Immigrants | Norway | 79.4 /100 | #146 | Good 5.2% |
| Argentineans | 79.2 /100 | #147 | Good 5.2% |
| Immigrants | Argentina | 78.7 /100 | #148 | Good 5.2% |
| Asians | 78.3 /100 | #149 | Good 5.2% |