Immigrants from Guatemala vs Shoshone Female Unemployment
COMPARE
Immigrants from Guatemala
Shoshone
Female Unemployment
Female Unemployment Comparison
Immigrants from Guatemala
Shoshone
6.1%
FEMALE UNEMPLOYMENT
0.0/ 100
METRIC RATING
287th/ 347
METRIC RANK
6.2%
FEMALE UNEMPLOYMENT
0.0/ 100
METRIC RATING
307th/ 347
METRIC RANK
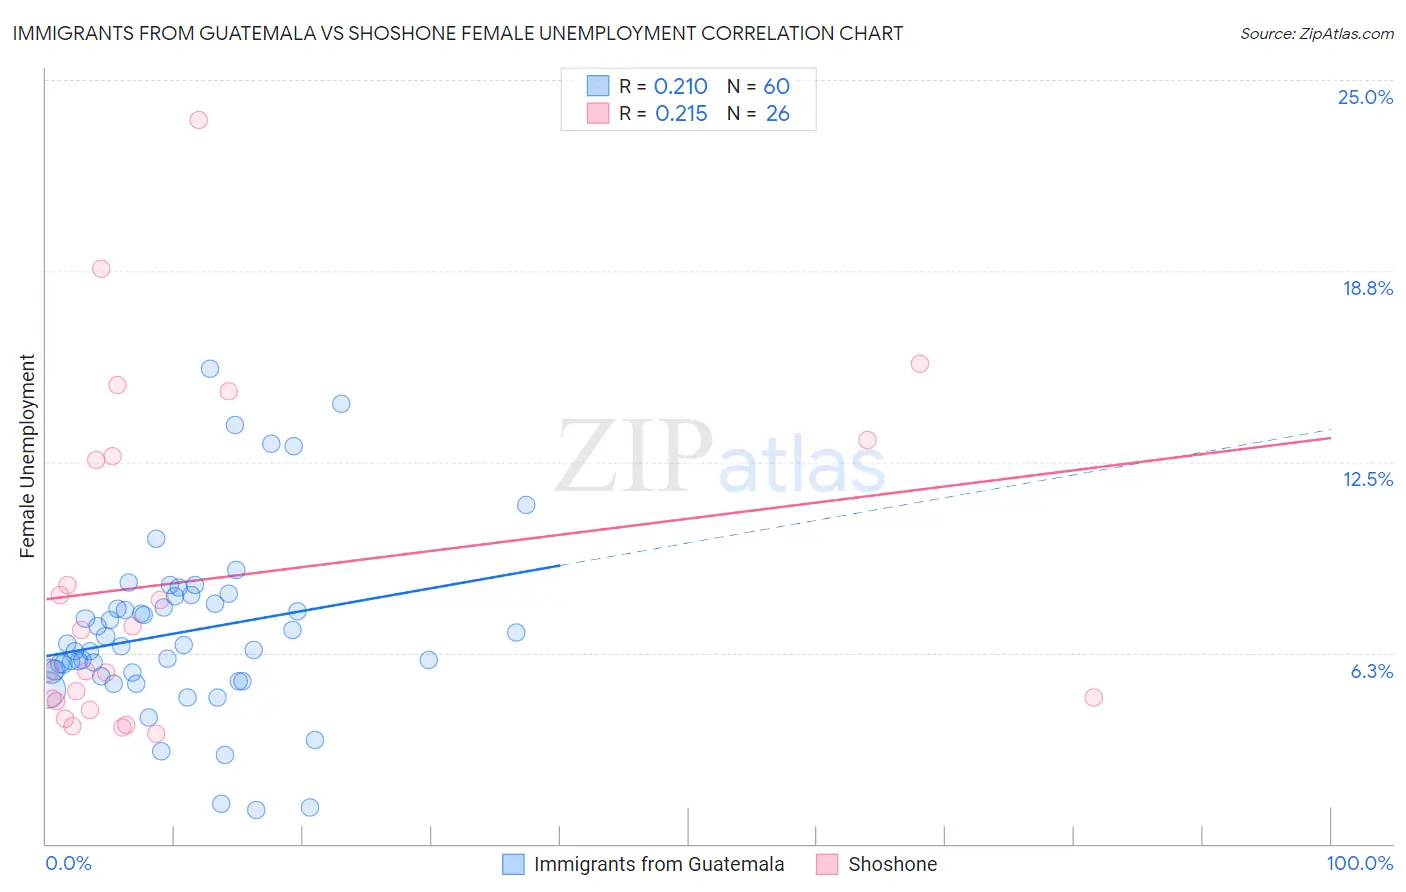
Immigrants from Guatemala vs Shoshone Female Unemployment Correlation Chart
The statistical analysis conducted on geographies consisting of 375,756,424 people shows a weak positive correlation between the proportion of Immigrants from Guatemala and unemploymnet rate among females in the United States with a correlation coefficient (R) of 0.210 and weighted average of 6.1%. Similarly, the statistical analysis conducted on geographies consisting of 66,499,639 people shows a weak positive correlation between the proportion of Shoshone and unemploymnet rate among females in the United States with a correlation coefficient (R) of 0.215 and weighted average of 6.2%, a difference of 2.3%.
Female Unemployment Correlation Summary
| Measurement | Immigrants from Guatemala | Shoshone |
| Minimum | 1.1% | 3.6% |
| Maximum | 15.6% | 23.7% |
| Range | 14.5% | 20.1% |
| Mean | 6.9% | 8.7% |
| Median | 6.5% | 6.3% |
| Interquartile 25% (IQ1) | 5.5% | 4.7% |
| Interquartile 75% (IQ3) | 8.0% | 12.7% |
| Interquartile Range (IQR) | 2.4% | 8.0% |
| Standard Deviation (Sample) | 2.9% | 5.4% |
| Standard Deviation (Population) | 2.9% | 5.3% |
Demographics Similar to Immigrants from Guatemala and Shoshone by Female Unemployment
In terms of female unemployment, the demographic groups most similar to Immigrants from Guatemala are Haitian (6.1%, a difference of 0.040%), Trinidadian and Tobagonian (6.1%, a difference of 0.050%), Immigrants from Caribbean (6.1%, a difference of 0.11%), Immigrants from West Indies (6.1%, a difference of 0.23%), and Immigrants from Trinidad and Tobago (6.1%, a difference of 0.29%). Similarly, the demographic groups most similar to Shoshone are Immigrants from Central America (6.2%, a difference of 0.010%), Spanish American Indian (6.2%, a difference of 0.17%), Immigrants from Jamaica (6.2%, a difference of 0.23%), Barbadian (6.2%, a difference of 0.59%), and U.S. Virgin Islander (6.2%, a difference of 0.94%).
| Demographics | Rating | Rank | Female Unemployment |
| Immigrants | Guatemala | 0.0 /100 | #287 | Tragic 6.1% |
| Haitians | 0.0 /100 | #288 | Tragic 6.1% |
| Trinidadians and Tobagonians | 0.0 /100 | #289 | Tragic 6.1% |
| Immigrants | Caribbean | 0.0 /100 | #290 | Tragic 6.1% |
| Immigrants | West Indies | 0.0 /100 | #291 | Tragic 6.1% |
| Immigrants | Trinidad and Tobago | 0.0 /100 | #292 | Tragic 6.1% |
| Mexicans | 0.0 /100 | #293 | Tragic 6.1% |
| Immigrants | El Salvador | 0.0 /100 | #294 | Tragic 6.1% |
| Immigrants | Latin America | 0.0 /100 | #295 | Tragic 6.1% |
| Alaskan Athabascans | 0.0 /100 | #296 | Tragic 6.1% |
| West Indians | 0.0 /100 | #297 | Tragic 6.1% |
| Jamaicans | 0.0 /100 | #298 | Tragic 6.1% |
| Ute | 0.0 /100 | #299 | Tragic 6.1% |
| Immigrants | Haiti | 0.0 /100 | #300 | Tragic 6.1% |
| Immigrants | Barbados | 0.0 /100 | #301 | Tragic 6.2% |
| U.S. Virgin Islanders | 0.0 /100 | #302 | Tragic 6.2% |
| Barbadians | 0.0 /100 | #303 | Tragic 6.2% |
| Immigrants | Jamaica | 0.0 /100 | #304 | Tragic 6.2% |
| Spanish American Indians | 0.0 /100 | #305 | Tragic 6.2% |
| Immigrants | Central America | 0.0 /100 | #306 | Tragic 6.2% |
| Shoshone | 0.0 /100 | #307 | Tragic 6.2% |