Immigrants from Germany vs Immigrants from Iran Unemployment Among Ages 45 to 54 years
COMPARE
Immigrants from Germany
Immigrants from Iran
Unemployment Among Ages 45 to 54 years
Unemployment Among Ages 45 to 54 years Comparison
Immigrants from Germany
Immigrants from Iran
4.4%
UNEMPLOYMENT AMONG AGES 45 TO 54 YEARS
85.9/ 100
METRIC RATING
131st/ 347
METRIC RANK
4.6%
UNEMPLOYMENT AMONG AGES 45 TO 54 YEARS
11.5/ 100
METRIC RATING
212th/ 347
METRIC RANK
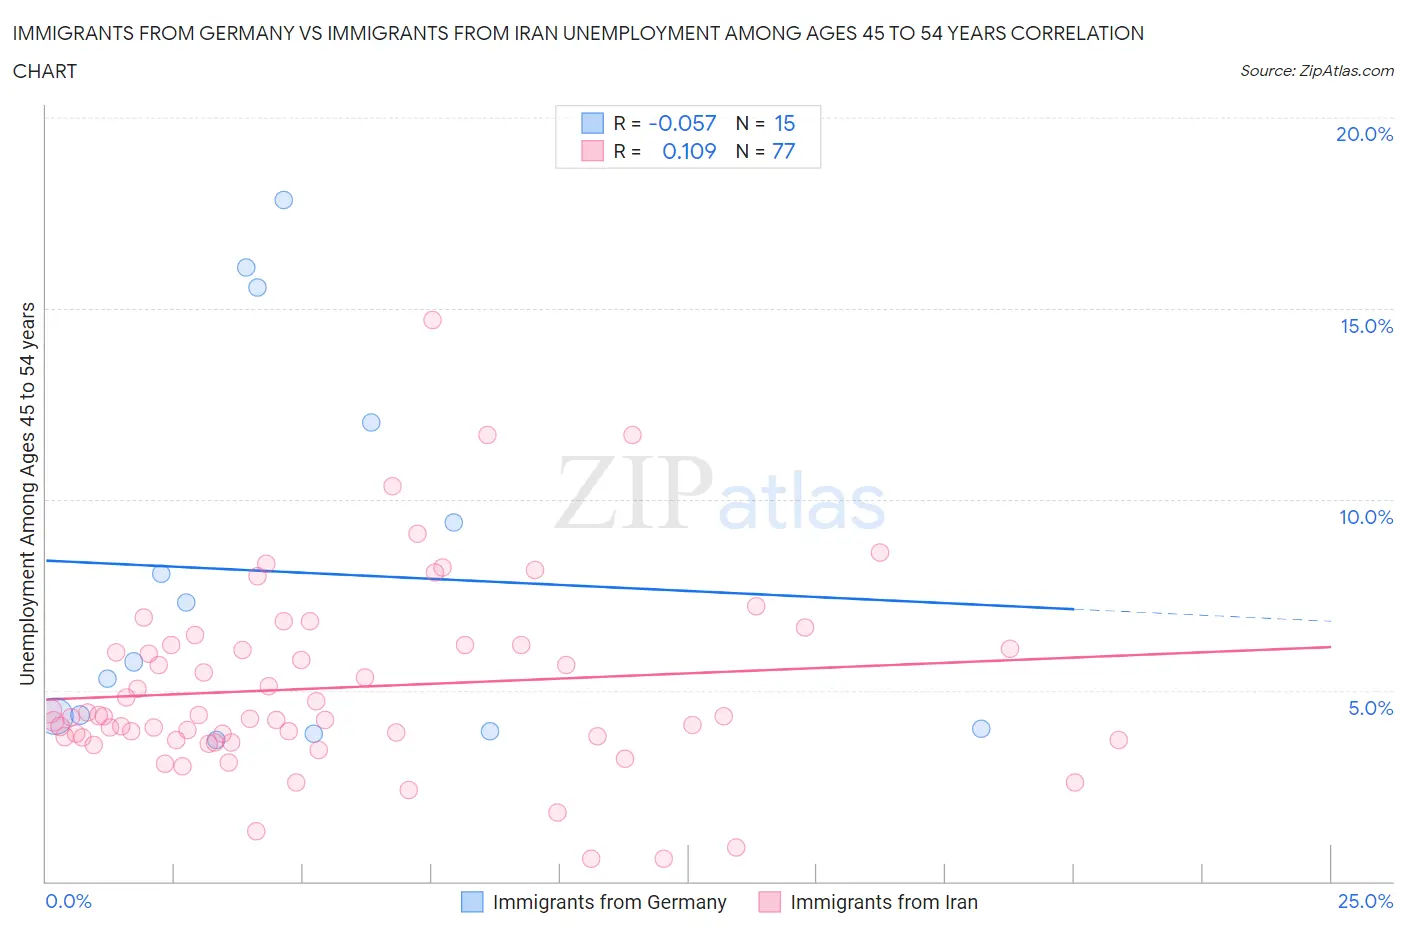
Immigrants from Germany vs Immigrants from Iran Unemployment Among Ages 45 to 54 years Correlation Chart
The statistical analysis conducted on geographies consisting of 446,927,338 people shows a slight negative correlation between the proportion of Immigrants from Germany and unemployment rate among population between the ages 45 and 54 in the United States with a correlation coefficient (R) of -0.057 and weighted average of 4.4%. Similarly, the statistical analysis conducted on geographies consisting of 276,106,625 people shows a poor positive correlation between the proportion of Immigrants from Iran and unemployment rate among population between the ages 45 and 54 in the United States with a correlation coefficient (R) of 0.109 and weighted average of 4.6%, a difference of 4.6%.
Unemployment Among Ages 45 to 54 years Correlation Summary
| Measurement | Immigrants from Germany | Immigrants from Iran |
| Minimum | 3.7% | 0.60% |
| Maximum | 17.8% | 14.7% |
| Range | 14.2% | 14.1% |
| Mean | 8.1% | 5.1% |
| Median | 5.7% | 4.3% |
| Interquartile 25% (IQ1) | 4.0% | 3.7% |
| Interquartile 75% (IQ3) | 12.0% | 6.2% |
| Interquartile Range (IQR) | 8.0% | 2.5% |
| Standard Deviation (Sample) | 5.0% | 2.5% |
| Standard Deviation (Population) | 4.8% | 2.5% |
Similar Demographics by Unemployment Among Ages 45 to 54 years
Demographics Similar to Immigrants from Germany by Unemployment Among Ages 45 to 54 years
In terms of unemployment among ages 45 to 54 years, the demographic groups most similar to Immigrants from Germany are Celtic (4.4%, a difference of 0.030%), Laotian (4.4%, a difference of 0.040%), Immigrants from Eastern Africa (4.4%, a difference of 0.080%), Immigrants from Northern Europe (4.4%, a difference of 0.10%), and Immigrants from Cameroon (4.4%, a difference of 0.10%).
| Demographics | Rating | Rank | Unemployment Among Ages 45 to 54 years |
| Spanish | 88.8 /100 | #124 | Excellent 4.4% |
| Immigrants | Vietnam | 88.6 /100 | #125 | Excellent 4.4% |
| Immigrants | Czechoslovakia | 87.8 /100 | #126 | Excellent 4.4% |
| Nicaraguans | 87.6 /100 | #127 | Excellent 4.4% |
| Immigrants | Northern Europe | 86.9 /100 | #128 | Excellent 4.4% |
| Laotians | 86.3 /100 | #129 | Excellent 4.4% |
| Celtics | 86.2 /100 | #130 | Excellent 4.4% |
| Immigrants | Germany | 85.9 /100 | #131 | Excellent 4.4% |
| Immigrants | Eastern Africa | 85.1 /100 | #132 | Excellent 4.4% |
| Immigrants | Cameroon | 84.8 /100 | #133 | Excellent 4.4% |
| Afghans | 84.6 /100 | #134 | Excellent 4.4% |
| Immigrants | Eastern Asia | 84.0 /100 | #135 | Excellent 4.4% |
| Immigrants | Middle Africa | 83.3 /100 | #136 | Excellent 4.4% |
| Lebanese | 81.9 /100 | #137 | Excellent 4.4% |
| Immigrants | Congo | 81.8 /100 | #138 | Excellent 4.4% |
Demographics Similar to Immigrants from Iran by Unemployment Among Ages 45 to 54 years
In terms of unemployment among ages 45 to 54 years, the demographic groups most similar to Immigrants from Iran are Creek (4.6%, a difference of 0.040%), Immigrants from South America (4.6%, a difference of 0.070%), Panamanian (4.6%, a difference of 0.090%), Cherokee (4.6%, a difference of 0.11%), and Immigrants from Panama (4.6%, a difference of 0.13%).
| Demographics | Rating | Rank | Unemployment Among Ages 45 to 54 years |
| Immigrants | Greece | 16.2 /100 | #205 | Poor 4.6% |
| Immigrants | Switzerland | 14.0 /100 | #206 | Poor 4.6% |
| Arabs | 13.7 /100 | #207 | Poor 4.6% |
| Immigrants | Africa | 13.6 /100 | #208 | Poor 4.6% |
| Immigrants | Nigeria | 13.3 /100 | #209 | Poor 4.6% |
| Immigrants | South America | 12.2 /100 | #210 | Poor 4.6% |
| Creek | 11.9 /100 | #211 | Poor 4.6% |
| Immigrants | Iran | 11.5 /100 | #212 | Poor 4.6% |
| Panamanians | 10.7 /100 | #213 | Poor 4.6% |
| Cherokee | 10.6 /100 | #214 | Poor 4.6% |
| Immigrants | Panama | 10.4 /100 | #215 | Poor 4.6% |
| Lumbee | 9.2 /100 | #216 | Tragic 4.6% |
| Immigrants | Cambodia | 7.4 /100 | #217 | Tragic 4.7% |
| Immigrants | Uganda | 7.1 /100 | #218 | Tragic 4.7% |
| Nigerians | 7.0 /100 | #219 | Tragic 4.7% |