Immigrants from Lithuania vs Immigrants from Iran Unemployment Among Ages 45 to 54 years
COMPARE
Immigrants from Lithuania
Immigrants from Iran
Unemployment Among Ages 45 to 54 years
Unemployment Among Ages 45 to 54 years Comparison
Immigrants from Lithuania
Immigrants from Iran
4.6%
UNEMPLOYMENT AMONG AGES 45 TO 54 YEARS
33.2/ 100
METRIC RATING
193rd/ 347
METRIC RANK
4.6%
UNEMPLOYMENT AMONG AGES 45 TO 54 YEARS
11.5/ 100
METRIC RATING
212th/ 347
METRIC RANK
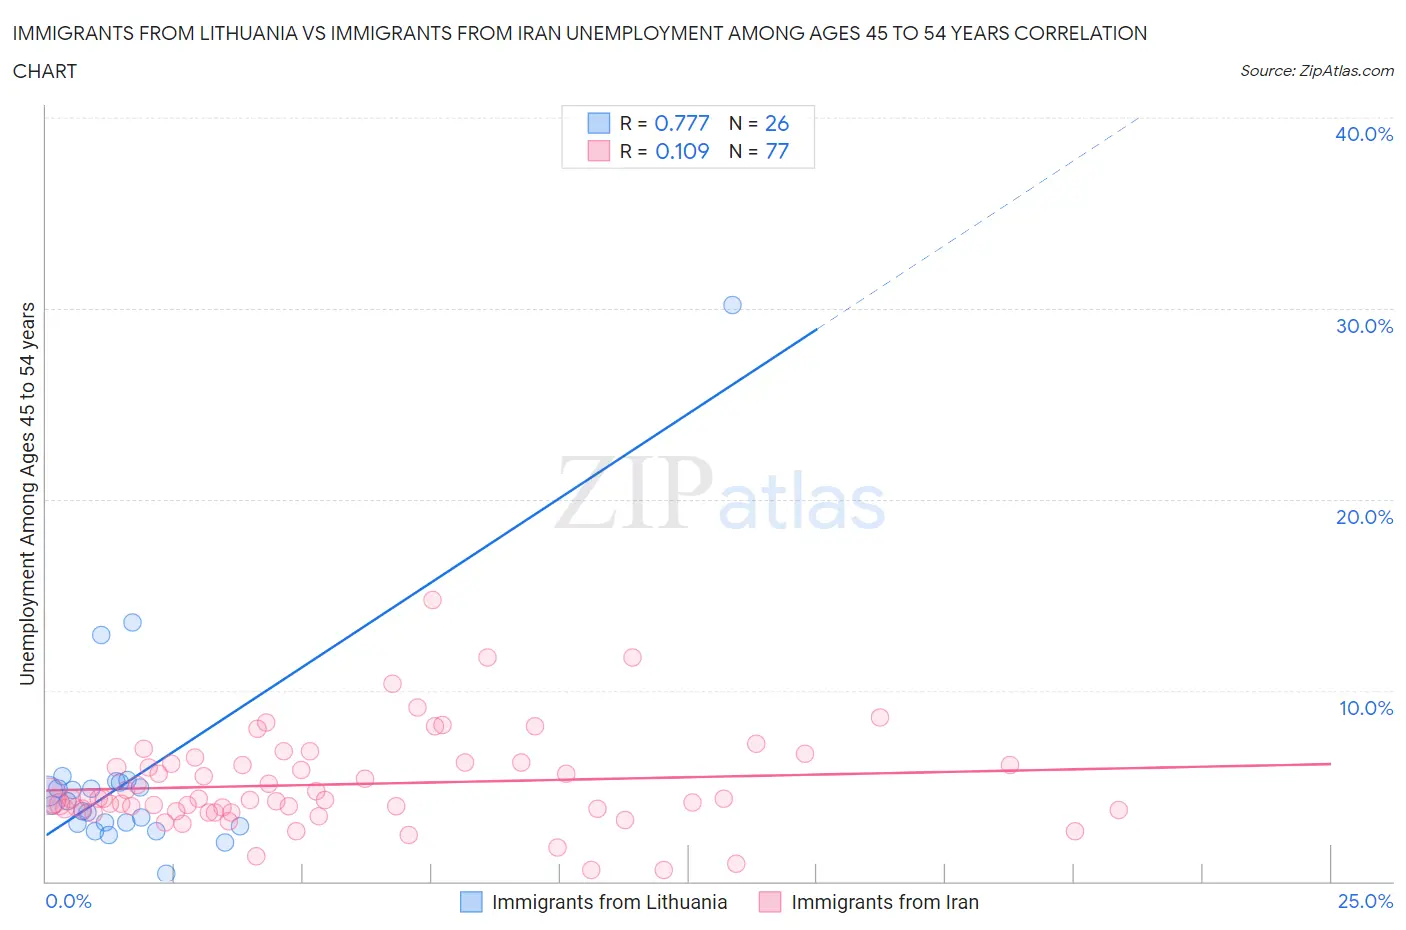
Immigrants from Lithuania vs Immigrants from Iran Unemployment Among Ages 45 to 54 years Correlation Chart
The statistical analysis conducted on geographies consisting of 116,885,827 people shows a strong positive correlation between the proportion of Immigrants from Lithuania and unemployment rate among population between the ages 45 and 54 in the United States with a correlation coefficient (R) of 0.777 and weighted average of 4.6%. Similarly, the statistical analysis conducted on geographies consisting of 276,106,625 people shows a poor positive correlation between the proportion of Immigrants from Iran and unemployment rate among population between the ages 45 and 54 in the United States with a correlation coefficient (R) of 0.109 and weighted average of 4.6%, a difference of 1.5%.
Unemployment Among Ages 45 to 54 years Correlation Summary
| Measurement | Immigrants from Lithuania | Immigrants from Iran |
| Minimum | 0.40% | 0.60% |
| Maximum | 30.2% | 14.7% |
| Range | 29.8% | 14.1% |
| Mean | 5.5% | 5.1% |
| Median | 4.1% | 4.3% |
| Interquartile 25% (IQ1) | 3.0% | 3.7% |
| Interquartile 75% (IQ3) | 5.1% | 6.2% |
| Interquartile Range (IQR) | 2.2% | 2.5% |
| Standard Deviation (Sample) | 5.8% | 2.5% |
| Standard Deviation (Population) | 5.7% | 2.5% |
Demographics Similar to Immigrants from Lithuania and Immigrants from Iran by Unemployment Among Ages 45 to 54 years
In terms of unemployment among ages 45 to 54 years, the demographic groups most similar to Immigrants from Lithuania are South American (4.6%, a difference of 0.020%), Immigrants from Thailand (4.6%, a difference of 0.040%), Peruvian (4.6%, a difference of 0.090%), Estonian (4.6%, a difference of 0.11%), and Albanian (4.6%, a difference of 0.11%). Similarly, the demographic groups most similar to Immigrants from Iran are Creek (4.6%, a difference of 0.040%), Immigrants from South America (4.6%, a difference of 0.070%), Immigrants from Nigeria (4.6%, a difference of 0.18%), Immigrants from Africa (4.6%, a difference of 0.21%), and Arab (4.6%, a difference of 0.23%).
| Demographics | Rating | Rank | Unemployment Among Ages 45 to 54 years |
| Immigrants | Thailand | 34.1 /100 | #192 | Fair 4.6% |
| Immigrants | Lithuania | 33.2 /100 | #193 | Fair 4.6% |
| South Americans | 32.9 /100 | #194 | Fair 4.6% |
| Peruvians | 31.5 /100 | #195 | Fair 4.6% |
| Estonians | 31.2 /100 | #196 | Fair 4.6% |
| Albanians | 31.1 /100 | #197 | Fair 4.6% |
| Immigrants | Belarus | 30.6 /100 | #198 | Fair 4.6% |
| Brazilians | 20.1 /100 | #199 | Fair 4.6% |
| Immigrants | Denmark | 19.8 /100 | #200 | Poor 4.6% |
| Immigrants | Costa Rica | 19.7 /100 | #201 | Poor 4.6% |
| Immigrants | Peru | 19.1 /100 | #202 | Poor 4.6% |
| Liberians | 18.7 /100 | #203 | Poor 4.6% |
| Immigrants | Morocco | 16.8 /100 | #204 | Poor 4.6% |
| Immigrants | Greece | 16.2 /100 | #205 | Poor 4.6% |
| Immigrants | Switzerland | 14.0 /100 | #206 | Poor 4.6% |
| Arabs | 13.7 /100 | #207 | Poor 4.6% |
| Immigrants | Africa | 13.6 /100 | #208 | Poor 4.6% |
| Immigrants | Nigeria | 13.3 /100 | #209 | Poor 4.6% |
| Immigrants | South America | 12.2 /100 | #210 | Poor 4.6% |
| Creek | 11.9 /100 | #211 | Poor 4.6% |
| Immigrants | Iran | 11.5 /100 | #212 | Poor 4.6% |