Immigrants from Germany vs French Canadian Unemployment Among Ages 45 to 54 years
COMPARE
Immigrants from Germany
French Canadian
Unemployment Among Ages 45 to 54 years
Unemployment Among Ages 45 to 54 years Comparison
Immigrants from Germany
French Canadians
4.4%
UNEMPLOYMENT AMONG AGES 45 TO 54 YEARS
85.9/ 100
METRIC RATING
131st/ 347
METRIC RANK
4.4%
UNEMPLOYMENT AMONG AGES 45 TO 54 YEARS
91.0/ 100
METRIC RATING
113th/ 347
METRIC RANK
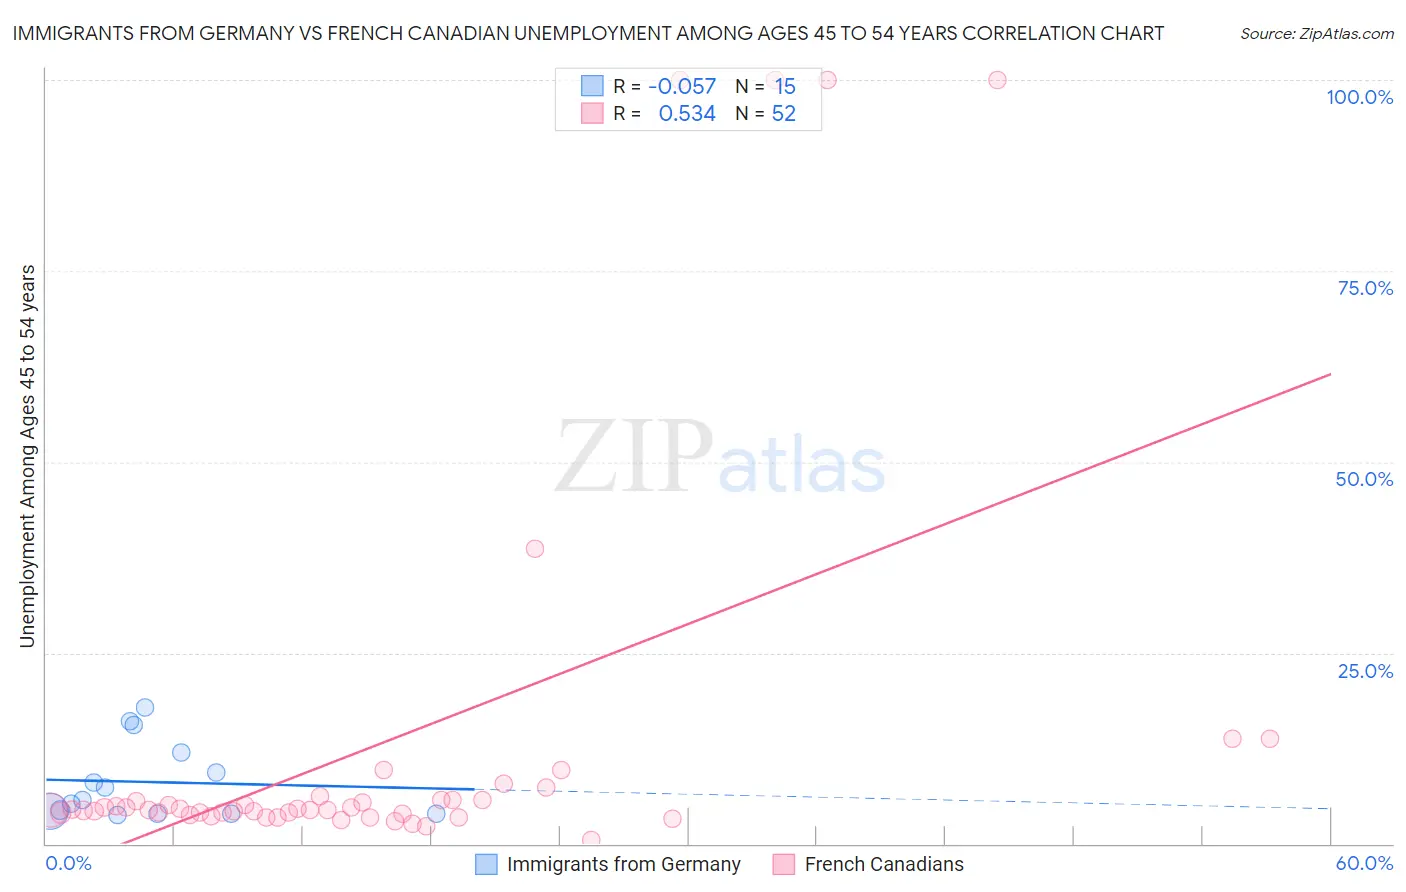
Immigrants from Germany vs French Canadian Unemployment Among Ages 45 to 54 years Correlation Chart
The statistical analysis conducted on geographies consisting of 446,927,338 people shows a slight negative correlation between the proportion of Immigrants from Germany and unemployment rate among population between the ages 45 and 54 in the United States with a correlation coefficient (R) of -0.057 and weighted average of 4.4%. Similarly, the statistical analysis conducted on geographies consisting of 476,387,703 people shows a substantial positive correlation between the proportion of French Canadians and unemployment rate among population between the ages 45 and 54 in the United States with a correlation coefficient (R) of 0.534 and weighted average of 4.4%, a difference of 0.61%.
Unemployment Among Ages 45 to 54 years Correlation Summary
| Measurement | Immigrants from Germany | French Canadian |
| Minimum | 3.7% | 0.50% |
| Maximum | 17.8% | 100.0% |
| Range | 14.2% | 99.5% |
| Mean | 8.1% | 12.9% |
| Median | 5.7% | 4.5% |
| Interquartile 25% (IQ1) | 4.0% | 4.0% |
| Interquartile 75% (IQ3) | 12.0% | 5.7% |
| Interquartile Range (IQR) | 8.0% | 1.8% |
| Standard Deviation (Sample) | 5.0% | 25.9% |
| Standard Deviation (Population) | 4.8% | 25.7% |
Demographics Similar to Immigrants from Germany and French Canadians by Unemployment Among Ages 45 to 54 years
In terms of unemployment among ages 45 to 54 years, the demographic groups most similar to Immigrants from Germany are Celtic (4.4%, a difference of 0.030%), Laotian (4.4%, a difference of 0.040%), Immigrants from Eastern Africa (4.4%, a difference of 0.080%), Immigrants from Northern Europe (4.4%, a difference of 0.10%), and Nicaraguan (4.4%, a difference of 0.18%). Similarly, the demographic groups most similar to French Canadians are Immigrants from Saudi Arabia (4.4%, a difference of 0.010%), Immigrants from Chile (4.4%, a difference of 0.020%), Pakistani (4.4%, a difference of 0.040%), Immigrants from North Macedonia (4.4%, a difference of 0.050%), and South African (4.4%, a difference of 0.080%).
| Demographics | Rating | Rank | Unemployment Among Ages 45 to 54 years |
| Immigrants | Saudi Arabia | 91.1 /100 | #112 | Exceptional 4.4% |
| French Canadians | 91.0 /100 | #113 | Exceptional 4.4% |
| Immigrants | Chile | 90.9 /100 | #114 | Exceptional 4.4% |
| Pakistanis | 90.7 /100 | #115 | Exceptional 4.4% |
| Immigrants | North Macedonia | 90.6 /100 | #116 | Exceptional 4.4% |
| South Africans | 90.4 /100 | #117 | Exceptional 4.4% |
| Immigrants | Romania | 90.0 /100 | #118 | Exceptional 4.4% |
| Native Hawaiians | 90.0 /100 | #119 | Excellent 4.4% |
| Americans | 89.6 /100 | #120 | Excellent 4.4% |
| Immigrants | Oceania | 89.5 /100 | #121 | Excellent 4.4% |
| Immigrants | Kazakhstan | 89.5 /100 | #122 | Excellent 4.4% |
| Immigrants | Asia | 88.8 /100 | #123 | Excellent 4.4% |
| Spanish | 88.8 /100 | #124 | Excellent 4.4% |
| Immigrants | Vietnam | 88.6 /100 | #125 | Excellent 4.4% |
| Immigrants | Czechoslovakia | 87.8 /100 | #126 | Excellent 4.4% |
| Nicaraguans | 87.6 /100 | #127 | Excellent 4.4% |
| Immigrants | Northern Europe | 86.9 /100 | #128 | Excellent 4.4% |
| Laotians | 86.3 /100 | #129 | Excellent 4.4% |
| Celtics | 86.2 /100 | #130 | Excellent 4.4% |
| Immigrants | Germany | 85.9 /100 | #131 | Excellent 4.4% |
| Immigrants | Eastern Africa | 85.1 /100 | #132 | Excellent 4.4% |