Immigrants from Brazil vs Immigrants from Iran Unemployment Among Ages 45 to 54 years
COMPARE
Immigrants from Brazil
Immigrants from Iran
Unemployment Among Ages 45 to 54 years
Unemployment Among Ages 45 to 54 years Comparison
Immigrants from Brazil
Immigrants from Iran
4.5%
UNEMPLOYMENT AMONG AGES 45 TO 54 YEARS
56.4/ 100
METRIC RATING
167th/ 347
METRIC RANK
4.6%
UNEMPLOYMENT AMONG AGES 45 TO 54 YEARS
11.5/ 100
METRIC RATING
212th/ 347
METRIC RANK
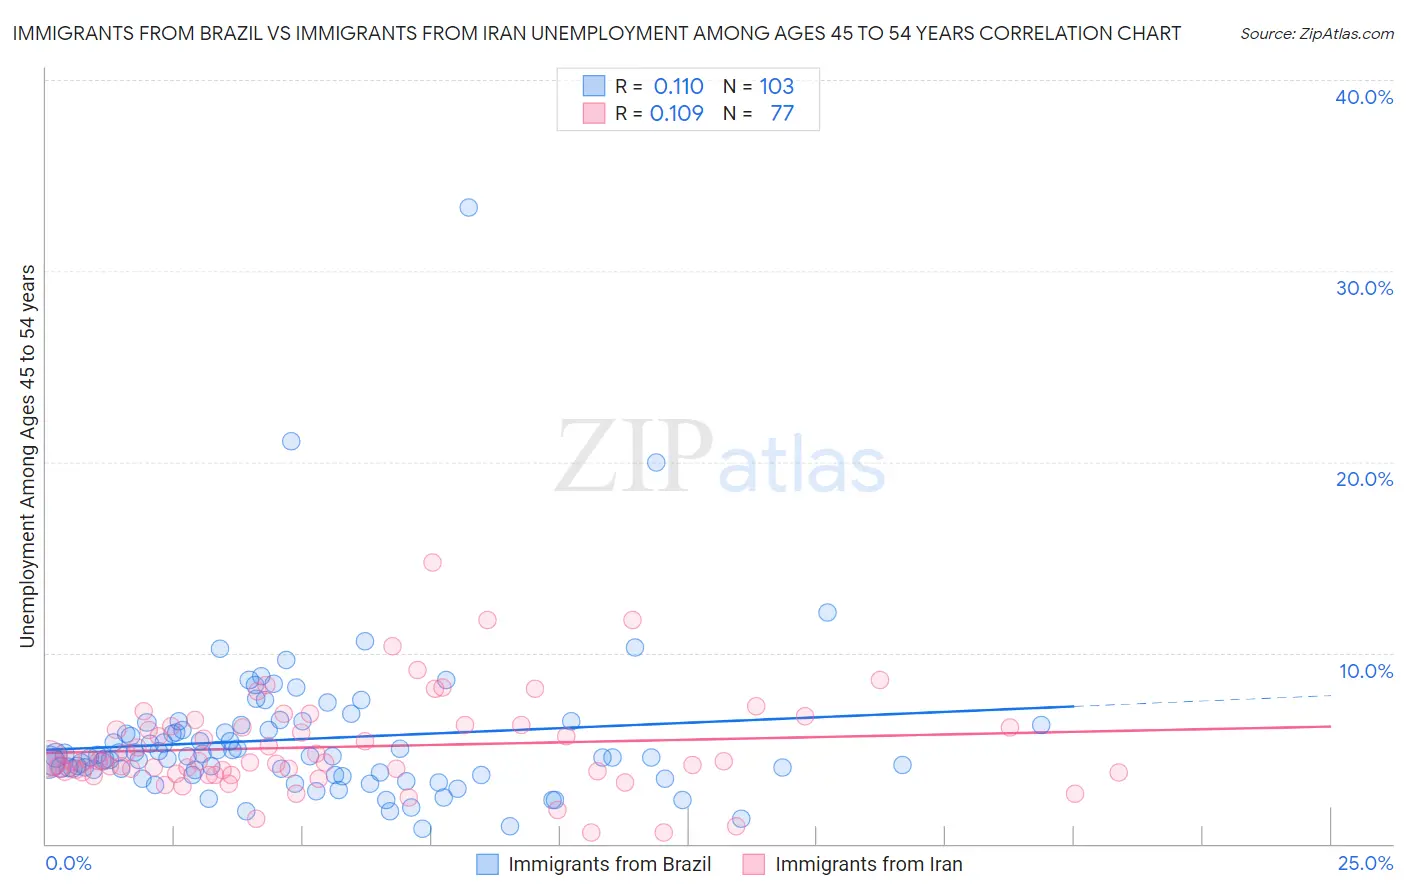
Immigrants from Brazil vs Immigrants from Iran Unemployment Among Ages 45 to 54 years Correlation Chart
The statistical analysis conducted on geographies consisting of 336,670,545 people shows a poor positive correlation between the proportion of Immigrants from Brazil and unemployment rate among population between the ages 45 and 54 in the United States with a correlation coefficient (R) of 0.110 and weighted average of 4.5%. Similarly, the statistical analysis conducted on geographies consisting of 276,106,625 people shows a poor positive correlation between the proportion of Immigrants from Iran and unemployment rate among population between the ages 45 and 54 in the United States with a correlation coefficient (R) of 0.109 and weighted average of 4.6%, a difference of 2.7%.
Unemployment Among Ages 45 to 54 years Correlation Summary
| Measurement | Immigrants from Brazil | Immigrants from Iran |
| Minimum | 0.80% | 0.60% |
| Maximum | 33.3% | 14.7% |
| Range | 32.5% | 14.1% |
| Mean | 5.5% | 5.1% |
| Median | 4.6% | 4.3% |
| Interquartile 25% (IQ1) | 3.6% | 3.7% |
| Interquartile 75% (IQ3) | 6.2% | 6.2% |
| Interquartile Range (IQR) | 2.6% | 2.5% |
| Standard Deviation (Sample) | 4.1% | 2.5% |
| Standard Deviation (Population) | 4.1% | 2.5% |
Similar Demographics by Unemployment Among Ages 45 to 54 years
Demographics Similar to Immigrants from Brazil by Unemployment Among Ages 45 to 54 years
In terms of unemployment among ages 45 to 54 years, the demographic groups most similar to Immigrants from Brazil are Immigrants from Western Europe (4.5%, a difference of 0.050%), Maltese (4.5%, a difference of 0.070%), Immigrants from Europe (4.5%, a difference of 0.080%), Immigrants from Egypt (4.5%, a difference of 0.080%), and Samoan (4.5%, a difference of 0.10%).
| Demographics | Rating | Rank | Unemployment Among Ages 45 to 54 years |
| Immigrants | South Eastern Asia | 62.0 /100 | #160 | Good 4.5% |
| Immigrants | Eastern Europe | 61.6 /100 | #161 | Good 4.5% |
| Immigrants | Indonesia | 60.3 /100 | #162 | Good 4.5% |
| Bangladeshis | 59.7 /100 | #163 | Average 4.5% |
| Samoans | 58.5 /100 | #164 | Average 4.5% |
| Maltese | 57.9 /100 | #165 | Average 4.5% |
| Immigrants | Western Europe | 57.4 /100 | #166 | Average 4.5% |
| Immigrants | Brazil | 56.4 /100 | #167 | Average 4.5% |
| Immigrants | Europe | 54.7 /100 | #168 | Average 4.5% |
| Immigrants | Egypt | 54.7 /100 | #169 | Average 4.5% |
| Spaniards | 54.3 /100 | #170 | Average 4.5% |
| Egyptians | 53.6 /100 | #171 | Average 4.5% |
| Colombians | 53.3 /100 | #172 | Average 4.5% |
| Immigrants | Colombia | 52.0 /100 | #173 | Average 4.5% |
| Immigrants | Hungary | 50.0 /100 | #174 | Average 4.5% |
Demographics Similar to Immigrants from Iran by Unemployment Among Ages 45 to 54 years
In terms of unemployment among ages 45 to 54 years, the demographic groups most similar to Immigrants from Iran are Creek (4.6%, a difference of 0.040%), Immigrants from South America (4.6%, a difference of 0.070%), Panamanian (4.6%, a difference of 0.090%), Cherokee (4.6%, a difference of 0.11%), and Immigrants from Panama (4.6%, a difference of 0.13%).
| Demographics | Rating | Rank | Unemployment Among Ages 45 to 54 years |
| Immigrants | Greece | 16.2 /100 | #205 | Poor 4.6% |
| Immigrants | Switzerland | 14.0 /100 | #206 | Poor 4.6% |
| Arabs | 13.7 /100 | #207 | Poor 4.6% |
| Immigrants | Africa | 13.6 /100 | #208 | Poor 4.6% |
| Immigrants | Nigeria | 13.3 /100 | #209 | Poor 4.6% |
| Immigrants | South America | 12.2 /100 | #210 | Poor 4.6% |
| Creek | 11.9 /100 | #211 | Poor 4.6% |
| Immigrants | Iran | 11.5 /100 | #212 | Poor 4.6% |
| Panamanians | 10.7 /100 | #213 | Poor 4.6% |
| Cherokee | 10.6 /100 | #214 | Poor 4.6% |
| Immigrants | Panama | 10.4 /100 | #215 | Poor 4.6% |
| Lumbee | 9.2 /100 | #216 | Tragic 4.6% |
| Immigrants | Cambodia | 7.4 /100 | #217 | Tragic 4.7% |
| Immigrants | Uganda | 7.1 /100 | #218 | Tragic 4.7% |
| Nigerians | 7.0 /100 | #219 | Tragic 4.7% |