Immigrants from Germany vs Immigrants from Iran Median Household Income
COMPARE
Immigrants from Germany
Immigrants from Iran
Median Household Income
Median Household Income Comparison
Immigrants from Germany
Immigrants from Iran
$86,764
MEDIAN HOUSEHOLD INCOME
74.4/ 100
METRIC RATING
154th/ 347
METRIC RANK
$108,055
MEDIAN HOUSEHOLD INCOME
100.0/ 100
METRIC RATING
8th/ 347
METRIC RANK
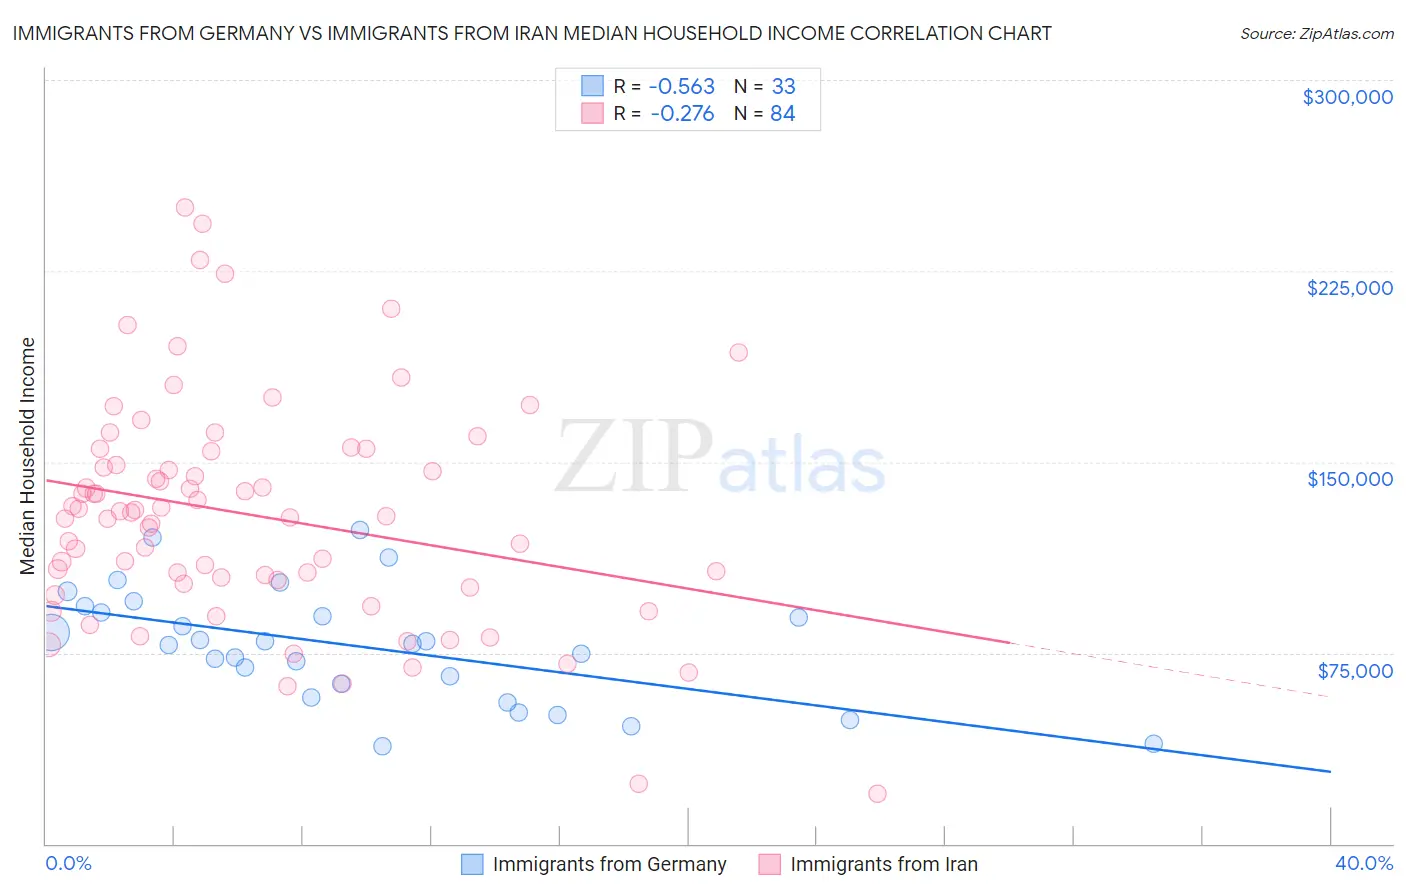
Immigrants from Germany vs Immigrants from Iran Median Household Income Correlation Chart
The statistical analysis conducted on geographies consisting of 463,670,643 people shows a substantial negative correlation between the proportion of Immigrants from Germany and median household income in the United States with a correlation coefficient (R) of -0.563 and weighted average of $86,764. Similarly, the statistical analysis conducted on geographies consisting of 279,821,960 people shows a weak negative correlation between the proportion of Immigrants from Iran and median household income in the United States with a correlation coefficient (R) of -0.276 and weighted average of $108,055, a difference of 24.5%.
Median Household Income Correlation Summary
| Measurement | Immigrants from Germany | Immigrants from Iran |
| Minimum | $38,452 | $19,722 |
| Maximum | $123,192 | $250,001 |
| Range | $84,740 | $230,279 |
| Mean | $77,580 | $128,949 |
| Median | $78,375 | $129,200 |
| Interquartile 25% (IQ1) | $60,226 | $102,878 |
| Interquartile 75% (IQ3) | $92,055 | $151,481 |
| Interquartile Range (IQR) | $31,829 | $48,604 |
| Standard Deviation (Sample) | $22,106 | $44,216 |
| Standard Deviation (Population) | $21,769 | $43,952 |
Similar Demographics by Median Household Income
Demographics Similar to Immigrants from Germany by Median Household Income
In terms of median household income, the demographic groups most similar to Immigrants from Germany are South American ($86,824, a difference of 0.070%), Immigrants from Saudi Arabia ($86,875, a difference of 0.13%), Carpatho Rusyn ($86,635, a difference of 0.15%), Hungarian ($86,920, a difference of 0.18%), and Basque ($87,001, a difference of 0.27%).
| Demographics | Rating | Rank | Median Household Income |
| South American Indians | 81.8 /100 | #147 | Excellent $87,446 |
| Costa Ricans | 80.0 /100 | #148 | Excellent $87,262 |
| Immigrants | Nepal | 77.7 /100 | #149 | Good $87,046 |
| Basques | 77.2 /100 | #150 | Good $87,001 |
| Hungarians | 76.3 /100 | #151 | Good $86,920 |
| Immigrants | Saudi Arabia | 75.8 /100 | #152 | Good $86,875 |
| South Americans | 75.1 /100 | #153 | Good $86,824 |
| Immigrants | Germany | 74.4 /100 | #154 | Good $86,764 |
| Carpatho Rusyns | 72.8 /100 | #155 | Good $86,635 |
| Immigrants | Albania | 71.5 /100 | #156 | Good $86,534 |
| Samoans | 71.0 /100 | #157 | Good $86,498 |
| Moroccans | 70.6 /100 | #158 | Good $86,468 |
| Immigrants | Uzbekistan | 70.1 /100 | #159 | Good $86,425 |
| Luxembourgers | 70.0 /100 | #160 | Good $86,418 |
| Slavs | 69.7 /100 | #161 | Good $86,398 |
Demographics Similar to Immigrants from Iran by Median Household Income
In terms of median household income, the demographic groups most similar to Immigrants from Iran are Okinawan ($106,624, a difference of 1.3%), Iranian ($109,835, a difference of 1.7%), Immigrants from South Central Asia ($106,057, a difference of 1.9%), Immigrants from Singapore ($110,428, a difference of 2.2%), and Thai ($110,648, a difference of 2.4%).
| Demographics | Rating | Rank | Median Household Income |
| Immigrants | Taiwan | 100.0 /100 | #1 | Exceptional $116,460 |
| Filipinos | 100.0 /100 | #2 | Exceptional $115,509 |
| Immigrants | India | 100.0 /100 | #3 | Exceptional $113,009 |
| Immigrants | Hong Kong | 100.0 /100 | #4 | Exceptional $111,519 |
| Thais | 100.0 /100 | #5 | Exceptional $110,648 |
| Immigrants | Singapore | 100.0 /100 | #6 | Exceptional $110,428 |
| Iranians | 100.0 /100 | #7 | Exceptional $109,835 |
| Immigrants | Iran | 100.0 /100 | #8 | Exceptional $108,055 |
| Okinawans | 100.0 /100 | #9 | Exceptional $106,624 |
| Immigrants | South Central Asia | 100.0 /100 | #10 | Exceptional $106,057 |
| Immigrants | China | 100.0 /100 | #11 | Exceptional $105,335 |
| Indians (Asian) | 100.0 /100 | #12 | Exceptional $105,262 |
| Immigrants | Eastern Asia | 100.0 /100 | #13 | Exceptional $104,796 |
| Immigrants | Ireland | 100.0 /100 | #14 | Exceptional $104,692 |
| Immigrants | Israel | 100.0 /100 | #15 | Exceptional $104,090 |