Immigrants from Indonesia vs Barbadian Female Unemployment
COMPARE
Immigrants from Indonesia
Barbadian
Female Unemployment
Female Unemployment Comparison
Immigrants from Indonesia
Barbadians
5.3%
FEMALE UNEMPLOYMENT
40.7/ 100
METRIC RATING
183rd/ 347
METRIC RANK
6.2%
FEMALE UNEMPLOYMENT
0.0/ 100
METRIC RATING
303rd/ 347
METRIC RANK
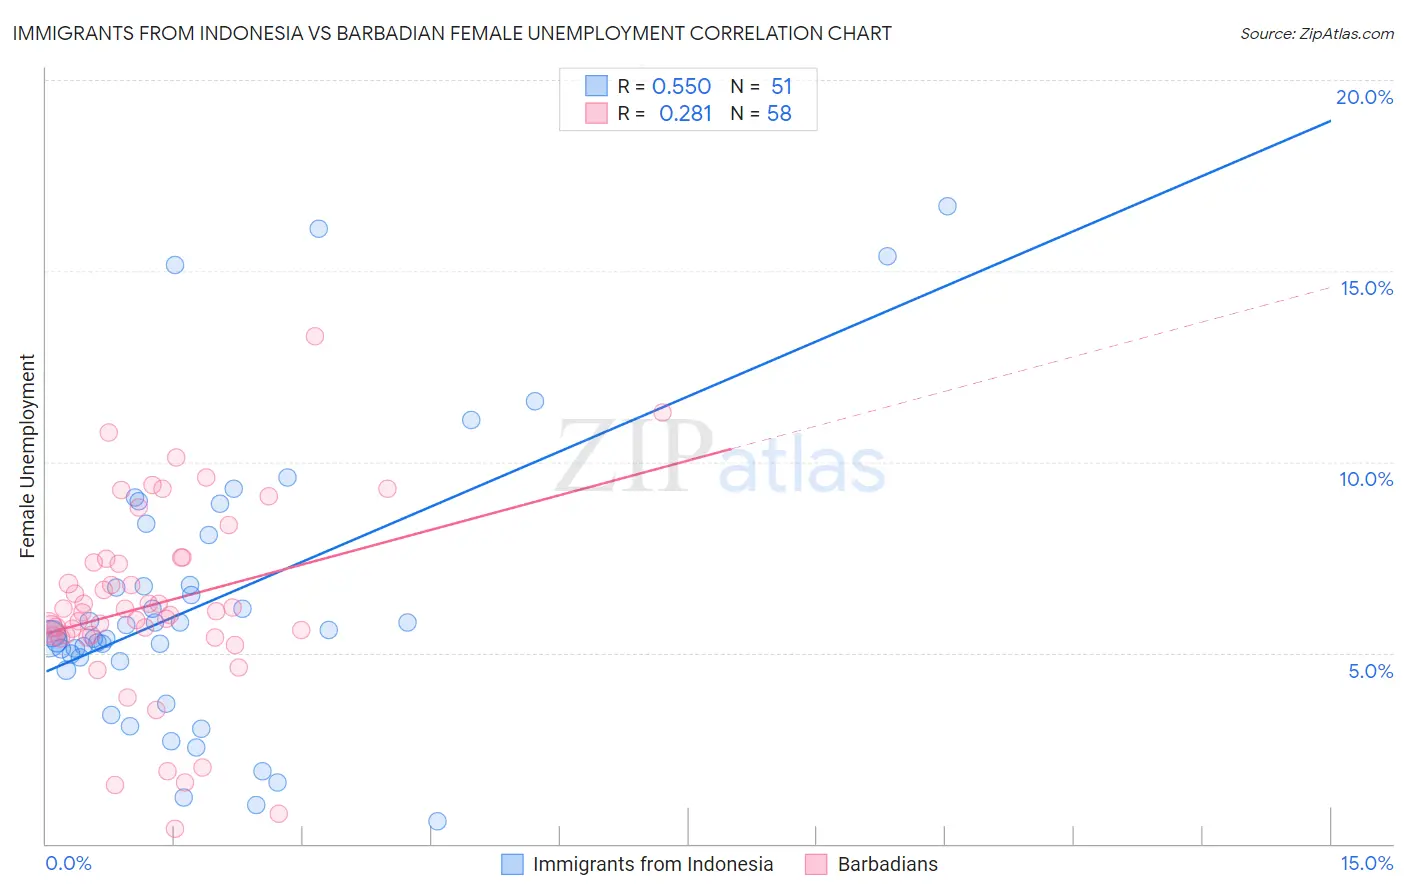
Immigrants from Indonesia vs Barbadian Female Unemployment Correlation Chart
The statistical analysis conducted on geographies consisting of 215,529,096 people shows a substantial positive correlation between the proportion of Immigrants from Indonesia and unemploymnet rate among females in the United States with a correlation coefficient (R) of 0.550 and weighted average of 5.3%. Similarly, the statistical analysis conducted on geographies consisting of 141,186,778 people shows a weak positive correlation between the proportion of Barbadians and unemploymnet rate among females in the United States with a correlation coefficient (R) of 0.281 and weighted average of 6.2%, a difference of 17.1%.
Female Unemployment Correlation Summary
| Measurement | Immigrants from Indonesia | Barbadian |
| Minimum | 0.60% | 0.40% |
| Maximum | 16.7% | 13.3% |
| Range | 16.1% | 12.9% |
| Mean | 6.3% | 6.3% |
| Median | 5.5% | 6.1% |
| Interquartile 25% (IQ1) | 4.8% | 5.4% |
| Interquartile 75% (IQ3) | 8.1% | 7.5% |
| Interquartile Range (IQR) | 3.3% | 2.0% |
| Standard Deviation (Sample) | 3.7% | 2.5% |
| Standard Deviation (Population) | 3.7% | 2.5% |
Similar Demographics by Female Unemployment
Demographics Similar to Immigrants from Indonesia by Female Unemployment
In terms of female unemployment, the demographic groups most similar to Immigrants from Indonesia are Immigrants from Ukraine (5.3%, a difference of 0.030%), Malaysian (5.3%, a difference of 0.040%), Immigrants from Belarus (5.3%, a difference of 0.080%), Taiwanese (5.3%, a difference of 0.12%), and Nonimmigrants (5.3%, a difference of 0.12%).
| Demographics | Rating | Rank | Female Unemployment |
| Immigrants | Vietnam | 47.5 /100 | #176 | Average 5.3% |
| Immigrants | Morocco | 47.4 /100 | #177 | Average 5.3% |
| Immigrants | Southern Europe | 46.2 /100 | #178 | Average 5.3% |
| Laotians | 45.1 /100 | #179 | Average 5.3% |
| Immigrants | Congo | 43.1 /100 | #180 | Average 5.3% |
| Taiwanese | 42.7 /100 | #181 | Average 5.3% |
| Immigrants | Nonimmigrants | 42.6 /100 | #182 | Average 5.3% |
| Immigrants | Indonesia | 40.7 /100 | #183 | Average 5.3% |
| Immigrants | Ukraine | 40.1 /100 | #184 | Average 5.3% |
| Malaysians | 40.1 /100 | #185 | Average 5.3% |
| Immigrants | Belarus | 39.4 /100 | #186 | Fair 5.3% |
| Immigrants | Albania | 35.4 /100 | #187 | Fair 5.3% |
| Afghans | 33.9 /100 | #188 | Fair 5.3% |
| Costa Ricans | 33.8 /100 | #189 | Fair 5.3% |
| Ugandans | 31.2 /100 | #190 | Fair 5.3% |
Demographics Similar to Barbadians by Female Unemployment
In terms of female unemployment, the demographic groups most similar to Barbadians are U.S. Virgin Islander (6.2%, a difference of 0.34%), Immigrants from Jamaica (6.2%, a difference of 0.37%), Spanish American Indian (6.2%, a difference of 0.42%), Immigrants from Barbados (6.2%, a difference of 0.50%), and Immigrants from Central America (6.2%, a difference of 0.58%).
| Demographics | Rating | Rank | Female Unemployment |
| Alaskan Athabascans | 0.0 /100 | #296 | Tragic 6.1% |
| West Indians | 0.0 /100 | #297 | Tragic 6.1% |
| Jamaicans | 0.0 /100 | #298 | Tragic 6.1% |
| Ute | 0.0 /100 | #299 | Tragic 6.1% |
| Immigrants | Haiti | 0.0 /100 | #300 | Tragic 6.1% |
| Immigrants | Barbados | 0.0 /100 | #301 | Tragic 6.2% |
| U.S. Virgin Islanders | 0.0 /100 | #302 | Tragic 6.2% |
| Barbadians | 0.0 /100 | #303 | Tragic 6.2% |
| Immigrants | Jamaica | 0.0 /100 | #304 | Tragic 6.2% |
| Spanish American Indians | 0.0 /100 | #305 | Tragic 6.2% |
| Immigrants | Central America | 0.0 /100 | #306 | Tragic 6.2% |
| Shoshone | 0.0 /100 | #307 | Tragic 6.2% |
| Hispanics or Latinos | 0.0 /100 | #308 | Tragic 6.2% |
| Ecuadorians | 0.0 /100 | #309 | Tragic 6.3% |
| Central American Indians | 0.0 /100 | #310 | Tragic 6.3% |