Immigrants from Fiji vs Alaska Native Unemployment Among Women with Children Ages 6 to 17 years
COMPARE
Immigrants from Fiji
Alaska Native
Unemployment Among Women with Children Ages 6 to 17 years
Unemployment Among Women with Children Ages 6 to 17 years Comparison
Immigrants from Fiji
Alaska Natives
7.3%
UNEMPLOYMENT AMONG WOMEN WITH CHILDREN AGES 6 TO 17 YEARS
100.0/ 100
METRIC RATING
10th/ 347
METRIC RANK
10.3%
UNEMPLOYMENT AMONG WOMEN WITH CHILDREN AGES 6 TO 17 YEARS
0.0/ 100
METRIC RATING
310th/ 347
METRIC RANK
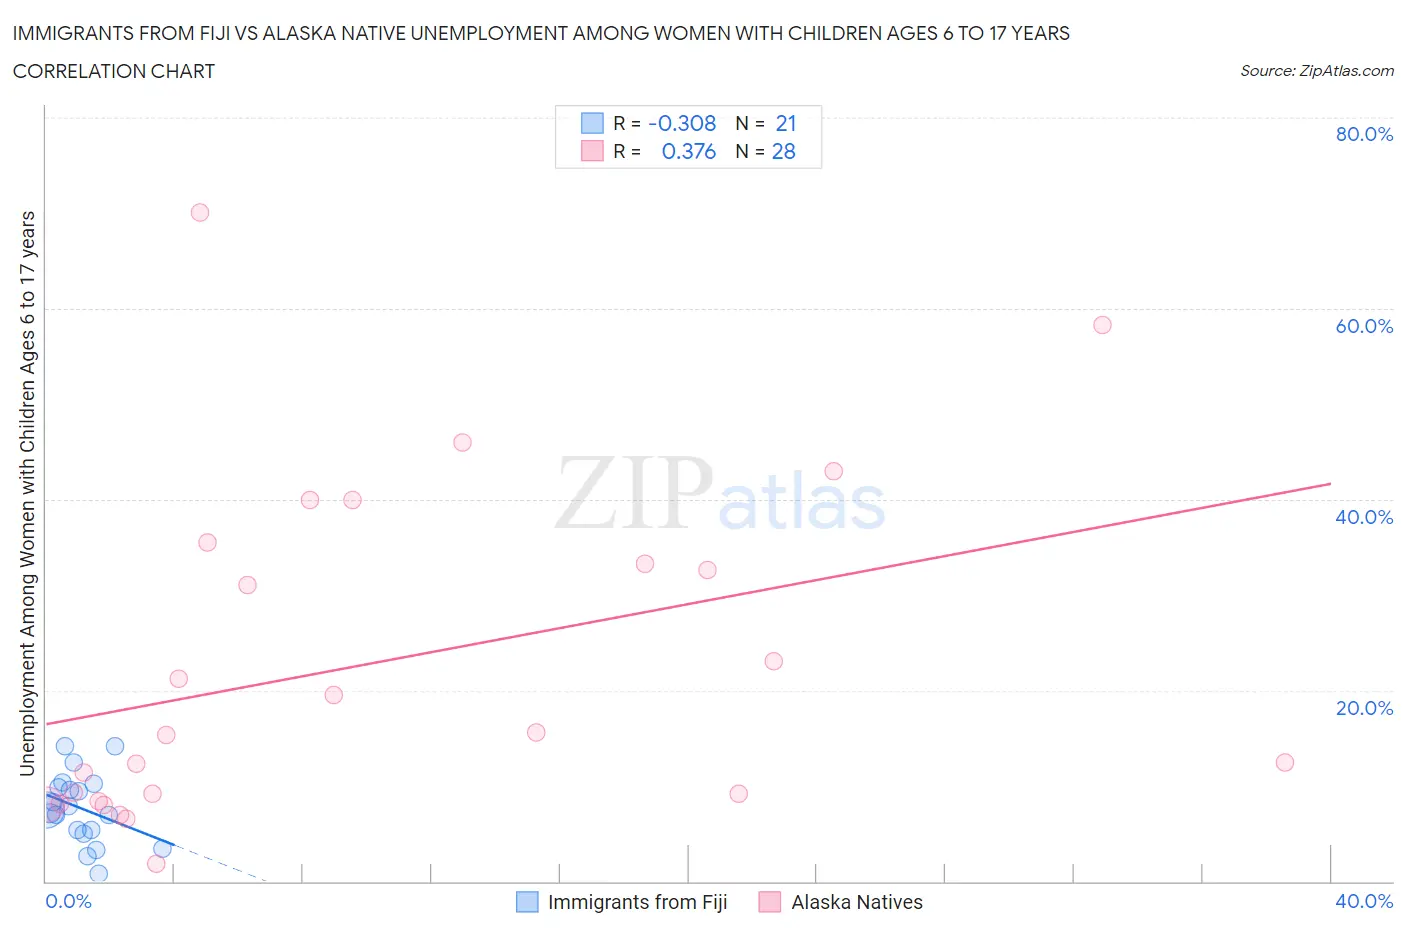
Immigrants from Fiji vs Alaska Native Unemployment Among Women with Children Ages 6 to 17 years Correlation Chart
The statistical analysis conducted on geographies consisting of 84,843,445 people shows a mild negative correlation between the proportion of Immigrants from Fiji and unemployment rate among women with children between the ages 6 and 17 in the United States with a correlation coefficient (R) of -0.308 and weighted average of 7.3%. Similarly, the statistical analysis conducted on geographies consisting of 69,081,648 people shows a mild positive correlation between the proportion of Alaska Natives and unemployment rate among women with children between the ages 6 and 17 in the United States with a correlation coefficient (R) of 0.376 and weighted average of 10.3%, a difference of 41.6%.
Unemployment Among Women with Children Ages 6 to 17 years Correlation Summary
| Measurement | Immigrants from Fiji | Alaska Native |
| Minimum | 0.80% | 1.9% |
| Maximum | 14.1% | 70.0% |
| Range | 13.3% | 68.1% |
| Mean | 7.6% | 22.7% |
| Median | 7.5% | 15.4% |
| Interquartile 25% (IQ1) | 5.2% | 8.8% |
| Interquartile 75% (IQ3) | 10.0% | 34.4% |
| Interquartile Range (IQR) | 4.8% | 25.6% |
| Standard Deviation (Sample) | 3.6% | 17.5% |
| Standard Deviation (Population) | 3.5% | 17.2% |
Similar Demographics by Unemployment Among Women with Children Ages 6 to 17 years
Demographics Similar to Immigrants from Fiji by Unemployment Among Women with Children Ages 6 to 17 years
In terms of unemployment among women with children ages 6 to 17 years, the demographic groups most similar to Immigrants from Fiji are Immigrants from Taiwan (7.3%, a difference of 0.70%), Assyrian/Chaldean/Syriac (7.2%, a difference of 0.97%), Bangladeshi (7.4%, a difference of 1.0%), Immigrants from Hong Kong (7.2%, a difference of 1.3%), and Indonesian (7.4%, a difference of 1.7%).
| Demographics | Rating | Rank | Unemployment Among Women with Children Ages 6 to 17 years |
| Tongans | 100.0 /100 | #3 | Exceptional 6.7% |
| Ute | 100.0 /100 | #4 | Exceptional 7.0% |
| Okinawans | 100.0 /100 | #5 | Exceptional 7.0% |
| Tlingit-Haida | 100.0 /100 | #6 | Exceptional 7.1% |
| Soviet Union | 100.0 /100 | #7 | Exceptional 7.1% |
| Immigrants | Hong Kong | 100.0 /100 | #8 | Exceptional 7.2% |
| Assyrians/Chaldeans/Syriacs | 100.0 /100 | #9 | Exceptional 7.2% |
| Immigrants | Fiji | 100.0 /100 | #10 | Exceptional 7.3% |
| Immigrants | Taiwan | 100.0 /100 | #11 | Exceptional 7.3% |
| Bangladeshis | 100.0 /100 | #12 | Exceptional 7.4% |
| Indonesians | 100.0 /100 | #13 | Exceptional 7.4% |
| Sudanese | 100.0 /100 | #14 | Exceptional 7.4% |
| Puget Sound Salish | 100.0 /100 | #15 | Exceptional 7.5% |
| Immigrants | Burma/Myanmar | 100.0 /100 | #16 | Exceptional 7.5% |
| Cambodians | 100.0 /100 | #17 | Exceptional 7.5% |
Demographics Similar to Alaska Natives by Unemployment Among Women with Children Ages 6 to 17 years
In terms of unemployment among women with children ages 6 to 17 years, the demographic groups most similar to Alaska Natives are Immigrants from Liberia (10.3%, a difference of 0.030%), French Canadian (10.3%, a difference of 0.050%), Dutch West Indian (10.2%, a difference of 0.59%), Immigrants from Senegal (10.2%, a difference of 0.61%), and Paraguayan (10.2%, a difference of 0.84%).
| Demographics | Rating | Rank | Unemployment Among Women with Children Ages 6 to 17 years |
| Immigrants | Ecuador | 0.0 /100 | #303 | Tragic 10.2% |
| Immigrants | Venezuela | 0.0 /100 | #304 | Tragic 10.2% |
| Immigrants | Nigeria | 0.0 /100 | #305 | Tragic 10.2% |
| Paraguayans | 0.0 /100 | #306 | Tragic 10.2% |
| Immigrants | Senegal | 0.0 /100 | #307 | Tragic 10.2% |
| Dutch West Indians | 0.0 /100 | #308 | Tragic 10.2% |
| French Canadians | 0.0 /100 | #309 | Tragic 10.3% |
| Alaska Natives | 0.0 /100 | #310 | Tragic 10.3% |
| Immigrants | Liberia | 0.0 /100 | #311 | Tragic 10.3% |
| Africans | 0.0 /100 | #312 | Tragic 10.4% |
| Americans | 0.0 /100 | #313 | Tragic 10.4% |
| Immigrants | Cabo Verde | 0.0 /100 | #314 | Tragic 10.4% |
| Bahamians | 0.0 /100 | #315 | Tragic 10.4% |
| Immigrants | Dominica | 0.0 /100 | #316 | Tragic 10.5% |
| Bermudans | 0.0 /100 | #317 | Tragic 10.5% |