Spanish American vs Alaska Native Unemployment Among Women with Children Ages 6 to 17 years
COMPARE
Spanish American
Alaska Native
Unemployment Among Women with Children Ages 6 to 17 years
Unemployment Among Women with Children Ages 6 to 17 years Comparison
Spanish Americans
Alaska Natives
8.4%
UNEMPLOYMENT AMONG WOMEN WITH CHILDREN AGES 6 TO 17 YEARS
99.8/ 100
METRIC RATING
73rd/ 347
METRIC RANK
10.3%
UNEMPLOYMENT AMONG WOMEN WITH CHILDREN AGES 6 TO 17 YEARS
0.0/ 100
METRIC RATING
310th/ 347
METRIC RANK
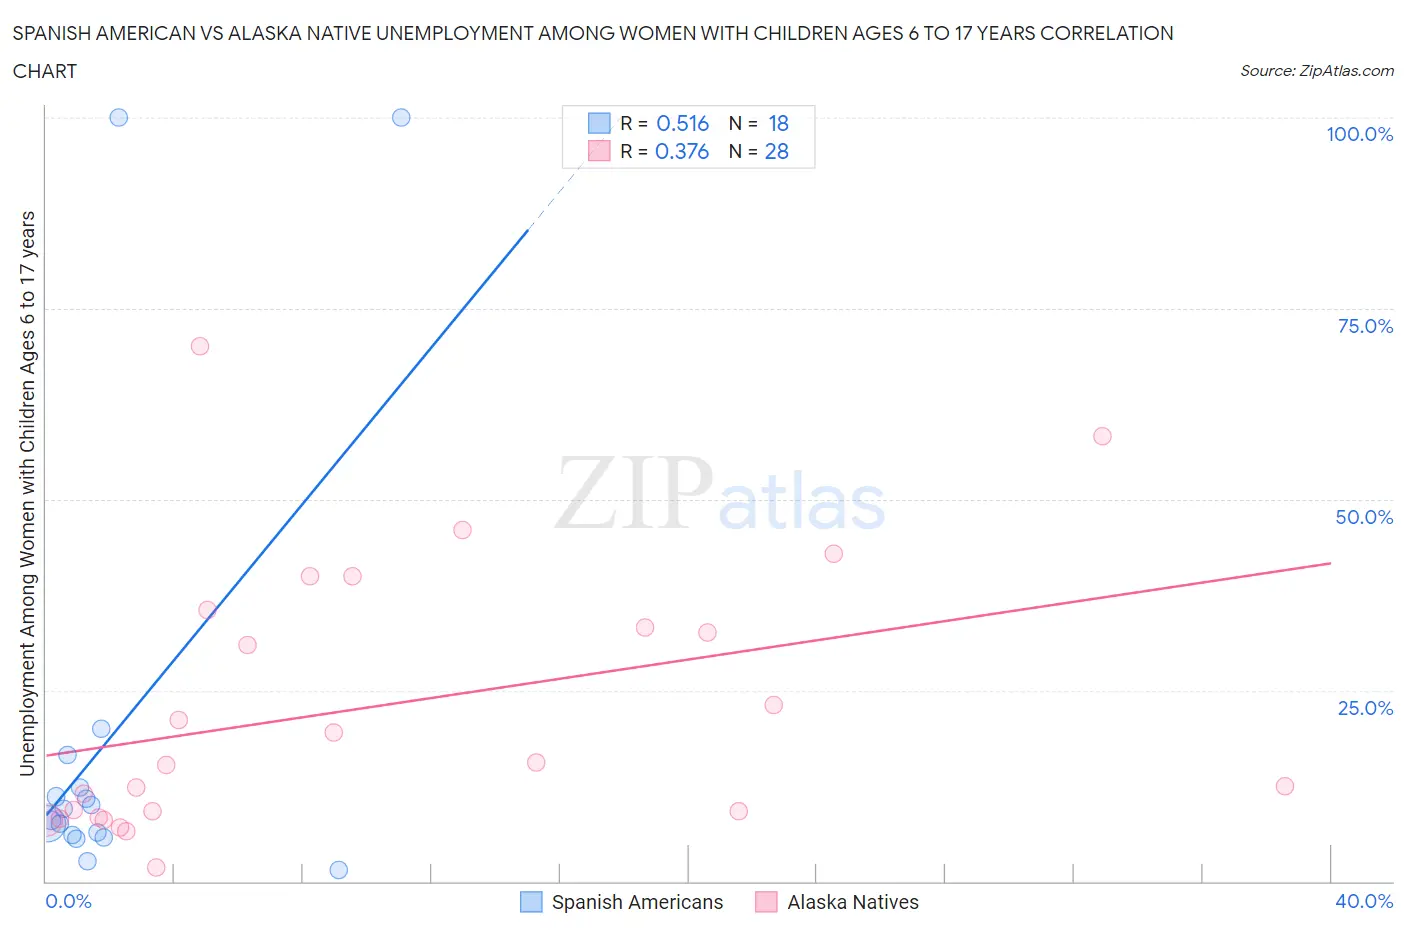
Spanish American vs Alaska Native Unemployment Among Women with Children Ages 6 to 17 years Correlation Chart
The statistical analysis conducted on geographies consisting of 92,309,003 people shows a substantial positive correlation between the proportion of Spanish Americans and unemployment rate among women with children between the ages 6 and 17 in the United States with a correlation coefficient (R) of 0.516 and weighted average of 8.4%. Similarly, the statistical analysis conducted on geographies consisting of 69,081,648 people shows a mild positive correlation between the proportion of Alaska Natives and unemployment rate among women with children between the ages 6 and 17 in the United States with a correlation coefficient (R) of 0.376 and weighted average of 10.3%, a difference of 23.4%.
Unemployment Among Women with Children Ages 6 to 17 years Correlation Summary
| Measurement | Spanish American | Alaska Native |
| Minimum | 1.4% | 1.9% |
| Maximum | 100.0% | 70.0% |
| Range | 98.6% | 68.1% |
| Mean | 18.9% | 22.7% |
| Median | 8.7% | 15.4% |
| Interquartile 25% (IQ1) | 6.0% | 8.8% |
| Interquartile 75% (IQ3) | 12.2% | 34.4% |
| Interquartile Range (IQR) | 6.2% | 25.6% |
| Standard Deviation (Sample) | 29.8% | 17.5% |
| Standard Deviation (Population) | 29.0% | 17.2% |
Similar Demographics by Unemployment Among Women with Children Ages 6 to 17 years
Demographics Similar to Spanish Americans by Unemployment Among Women with Children Ages 6 to 17 years
In terms of unemployment among women with children ages 6 to 17 years, the demographic groups most similar to Spanish Americans are Samoan (8.4%, a difference of 0.35%), Immigrants from Nepal (8.3%, a difference of 0.38%), Immigrants from Australia (8.3%, a difference of 0.41%), Immigrants from Sri Lanka (8.4%, a difference of 0.43%), and Immigrants from Moldova (8.4%, a difference of 0.46%).
| Demographics | Rating | Rank | Unemployment Among Women with Children Ages 6 to 17 years |
| Luxembourgers | 99.9 /100 | #66 | Exceptional 8.3% |
| Armenians | 99.9 /100 | #67 | Exceptional 8.3% |
| Marshallese | 99.9 /100 | #68 | Exceptional 8.3% |
| Immigrants | Thailand | 99.9 /100 | #69 | Exceptional 8.3% |
| Norwegians | 99.9 /100 | #70 | Exceptional 8.3% |
| Immigrants | Australia | 99.8 /100 | #71 | Exceptional 8.3% |
| Immigrants | Nepal | 99.8 /100 | #72 | Exceptional 8.3% |
| Spanish Americans | 99.8 /100 | #73 | Exceptional 8.4% |
| Samoans | 99.7 /100 | #74 | Exceptional 8.4% |
| Immigrants | Sri Lanka | 99.7 /100 | #75 | Exceptional 8.4% |
| Immigrants | Moldova | 99.7 /100 | #76 | Exceptional 8.4% |
| Iraqis | 99.7 /100 | #77 | Exceptional 8.4% |
| Pakistanis | 99.6 /100 | #78 | Exceptional 8.4% |
| Mongolians | 99.6 /100 | #79 | Exceptional 8.4% |
| Immigrants | Belarus | 99.6 /100 | #80 | Exceptional 8.4% |
Demographics Similar to Alaska Natives by Unemployment Among Women with Children Ages 6 to 17 years
In terms of unemployment among women with children ages 6 to 17 years, the demographic groups most similar to Alaska Natives are Immigrants from Liberia (10.3%, a difference of 0.030%), French Canadian (10.3%, a difference of 0.050%), Dutch West Indian (10.2%, a difference of 0.59%), Immigrants from Senegal (10.2%, a difference of 0.61%), and Paraguayan (10.2%, a difference of 0.84%).
| Demographics | Rating | Rank | Unemployment Among Women with Children Ages 6 to 17 years |
| Immigrants | Ecuador | 0.0 /100 | #303 | Tragic 10.2% |
| Immigrants | Venezuela | 0.0 /100 | #304 | Tragic 10.2% |
| Immigrants | Nigeria | 0.0 /100 | #305 | Tragic 10.2% |
| Paraguayans | 0.0 /100 | #306 | Tragic 10.2% |
| Immigrants | Senegal | 0.0 /100 | #307 | Tragic 10.2% |
| Dutch West Indians | 0.0 /100 | #308 | Tragic 10.2% |
| French Canadians | 0.0 /100 | #309 | Tragic 10.3% |
| Alaska Natives | 0.0 /100 | #310 | Tragic 10.3% |
| Immigrants | Liberia | 0.0 /100 | #311 | Tragic 10.3% |
| Africans | 0.0 /100 | #312 | Tragic 10.4% |
| Americans | 0.0 /100 | #313 | Tragic 10.4% |
| Immigrants | Cabo Verde | 0.0 /100 | #314 | Tragic 10.4% |
| Bahamians | 0.0 /100 | #315 | Tragic 10.4% |
| Immigrants | Dominica | 0.0 /100 | #316 | Tragic 10.5% |
| Bermudans | 0.0 /100 | #317 | Tragic 10.5% |