Guatemalan vs Alaska Native Unemployment Among Women with Children Ages 6 to 17 years
COMPARE
Guatemalan
Alaska Native
Unemployment Among Women with Children Ages 6 to 17 years
Unemployment Among Women with Children Ages 6 to 17 years Comparison
Guatemalans
Alaska Natives
9.3%
UNEMPLOYMENT AMONG WOMEN WITH CHILDREN AGES 6 TO 17 YEARS
2.3/ 100
METRIC RATING
240th/ 347
METRIC RANK
10.3%
UNEMPLOYMENT AMONG WOMEN WITH CHILDREN AGES 6 TO 17 YEARS
0.0/ 100
METRIC RATING
310th/ 347
METRIC RANK
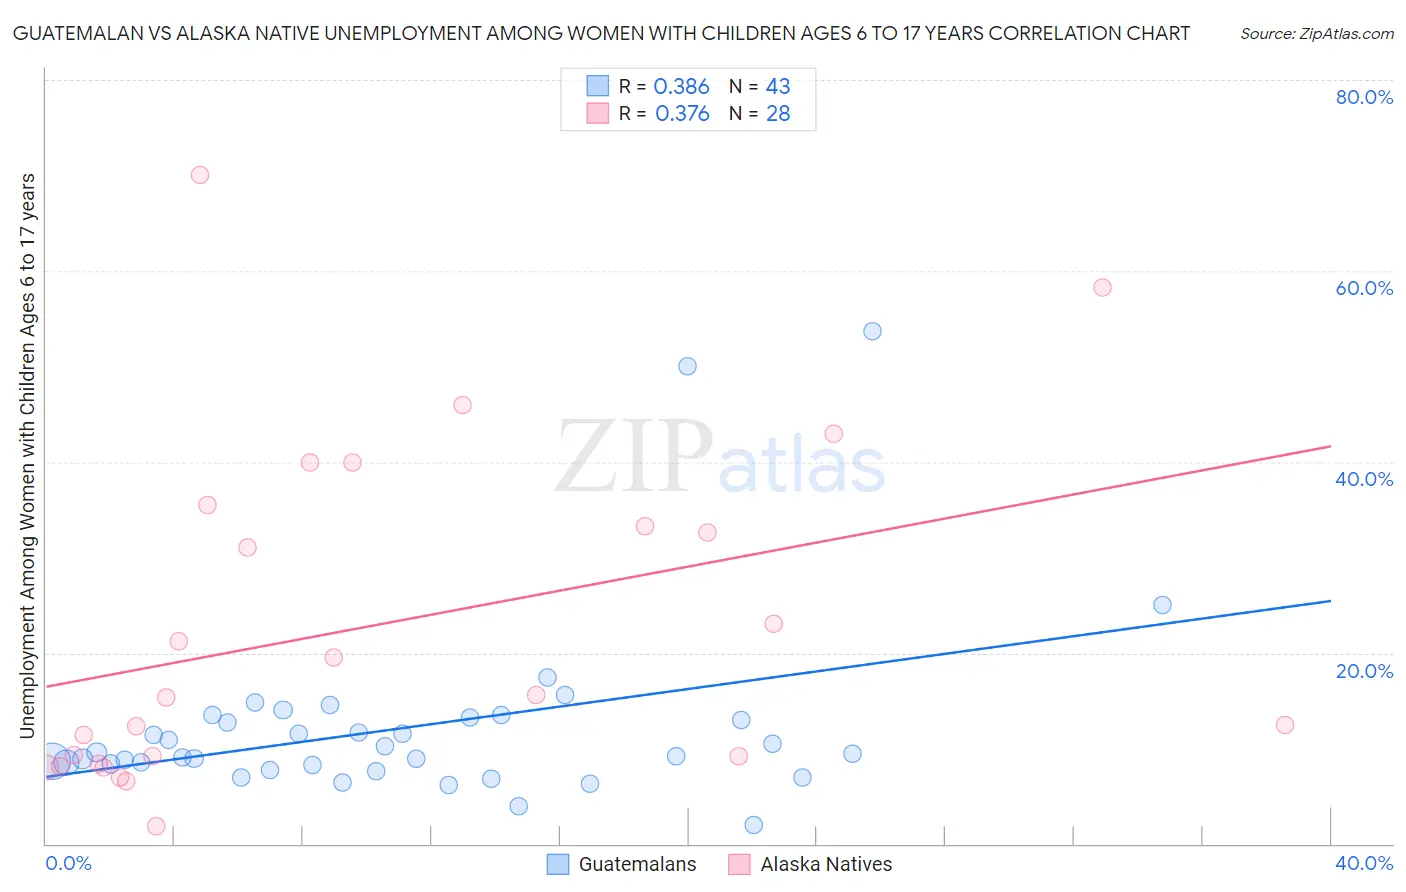
Guatemalan vs Alaska Native Unemployment Among Women with Children Ages 6 to 17 years Correlation Chart
The statistical analysis conducted on geographies consisting of 297,853,121 people shows a mild positive correlation between the proportion of Guatemalans and unemployment rate among women with children between the ages 6 and 17 in the United States with a correlation coefficient (R) of 0.386 and weighted average of 9.3%. Similarly, the statistical analysis conducted on geographies consisting of 69,081,648 people shows a mild positive correlation between the proportion of Alaska Natives and unemployment rate among women with children between the ages 6 and 17 in the United States with a correlation coefficient (R) of 0.376 and weighted average of 10.3%, a difference of 10.4%.
Unemployment Among Women with Children Ages 6 to 17 years Correlation Summary
| Measurement | Guatemalan | Alaska Native |
| Minimum | 2.0% | 1.9% |
| Maximum | 53.7% | 70.0% |
| Range | 51.7% | 68.1% |
| Mean | 12.2% | 22.7% |
| Median | 9.4% | 15.4% |
| Interquartile 25% (IQ1) | 8.2% | 8.8% |
| Interquartile 75% (IQ3) | 13.3% | 34.4% |
| Interquartile Range (IQR) | 5.1% | 25.6% |
| Standard Deviation (Sample) | 9.7% | 17.5% |
| Standard Deviation (Population) | 9.6% | 17.2% |
Similar Demographics by Unemployment Among Women with Children Ages 6 to 17 years
Demographics Similar to Guatemalans by Unemployment Among Women with Children Ages 6 to 17 years
In terms of unemployment among women with children ages 6 to 17 years, the demographic groups most similar to Guatemalans are Colombian (9.3%, a difference of 0.070%), Immigrants from Colombia (9.3%, a difference of 0.090%), Arab (9.3%, a difference of 0.14%), Immigrants from Saudi Arabia (9.3%, a difference of 0.14%), and Scottish (9.4%, a difference of 0.18%).
| Demographics | Rating | Rank | Unemployment Among Women with Children Ages 6 to 17 years |
| Immigrants | St. Vincent and the Grenadines | 3.3 /100 | #233 | Tragic 9.3% |
| Mexicans | 3.2 /100 | #234 | Tragic 9.3% |
| Uruguayans | 3.0 /100 | #235 | Tragic 9.3% |
| Hungarians | 3.0 /100 | #236 | Tragic 9.3% |
| Immigrants | Belize | 2.8 /100 | #237 | Tragic 9.3% |
| Arabs | 2.7 /100 | #238 | Tragic 9.3% |
| Immigrants | Saudi Arabia | 2.7 /100 | #239 | Tragic 9.3% |
| Guatemalans | 2.3 /100 | #240 | Tragic 9.3% |
| Colombians | 2.2 /100 | #241 | Tragic 9.3% |
| Immigrants | Colombia | 2.1 /100 | #242 | Tragic 9.3% |
| Scottish | 2.0 /100 | #243 | Tragic 9.4% |
| English | 1.9 /100 | #244 | Tragic 9.4% |
| Immigrants | Cameroon | 1.8 /100 | #245 | Tragic 9.4% |
| Immigrants | Africa | 1.6 /100 | #246 | Tragic 9.4% |
| Poles | 1.5 /100 | #247 | Tragic 9.4% |
Demographics Similar to Alaska Natives by Unemployment Among Women with Children Ages 6 to 17 years
In terms of unemployment among women with children ages 6 to 17 years, the demographic groups most similar to Alaska Natives are Immigrants from Liberia (10.3%, a difference of 0.030%), French Canadian (10.3%, a difference of 0.050%), Dutch West Indian (10.2%, a difference of 0.59%), Immigrants from Senegal (10.2%, a difference of 0.61%), and Paraguayan (10.2%, a difference of 0.84%).
| Demographics | Rating | Rank | Unemployment Among Women with Children Ages 6 to 17 years |
| Immigrants | Ecuador | 0.0 /100 | #303 | Tragic 10.2% |
| Immigrants | Venezuela | 0.0 /100 | #304 | Tragic 10.2% |
| Immigrants | Nigeria | 0.0 /100 | #305 | Tragic 10.2% |
| Paraguayans | 0.0 /100 | #306 | Tragic 10.2% |
| Immigrants | Senegal | 0.0 /100 | #307 | Tragic 10.2% |
| Dutch West Indians | 0.0 /100 | #308 | Tragic 10.2% |
| French Canadians | 0.0 /100 | #309 | Tragic 10.3% |
| Alaska Natives | 0.0 /100 | #310 | Tragic 10.3% |
| Immigrants | Liberia | 0.0 /100 | #311 | Tragic 10.3% |
| Africans | 0.0 /100 | #312 | Tragic 10.4% |
| Americans | 0.0 /100 | #313 | Tragic 10.4% |
| Immigrants | Cabo Verde | 0.0 /100 | #314 | Tragic 10.4% |
| Bahamians | 0.0 /100 | #315 | Tragic 10.4% |
| Immigrants | Dominica | 0.0 /100 | #316 | Tragic 10.5% |
| Bermudans | 0.0 /100 | #317 | Tragic 10.5% |