Immigrants from Fiji vs Colombian Unemployment Among Women with Children Ages 6 to 17 years
COMPARE
Immigrants from Fiji
Colombian
Unemployment Among Women with Children Ages 6 to 17 years
Unemployment Among Women with Children Ages 6 to 17 years Comparison
Immigrants from Fiji
Colombians
7.3%
UNEMPLOYMENT AMONG WOMEN WITH CHILDREN AGES 6 TO 17 YEARS
100.0/ 100
METRIC RATING
10th/ 347
METRIC RANK
9.3%
UNEMPLOYMENT AMONG WOMEN WITH CHILDREN AGES 6 TO 17 YEARS
2.2/ 100
METRIC RATING
241st/ 347
METRIC RANK
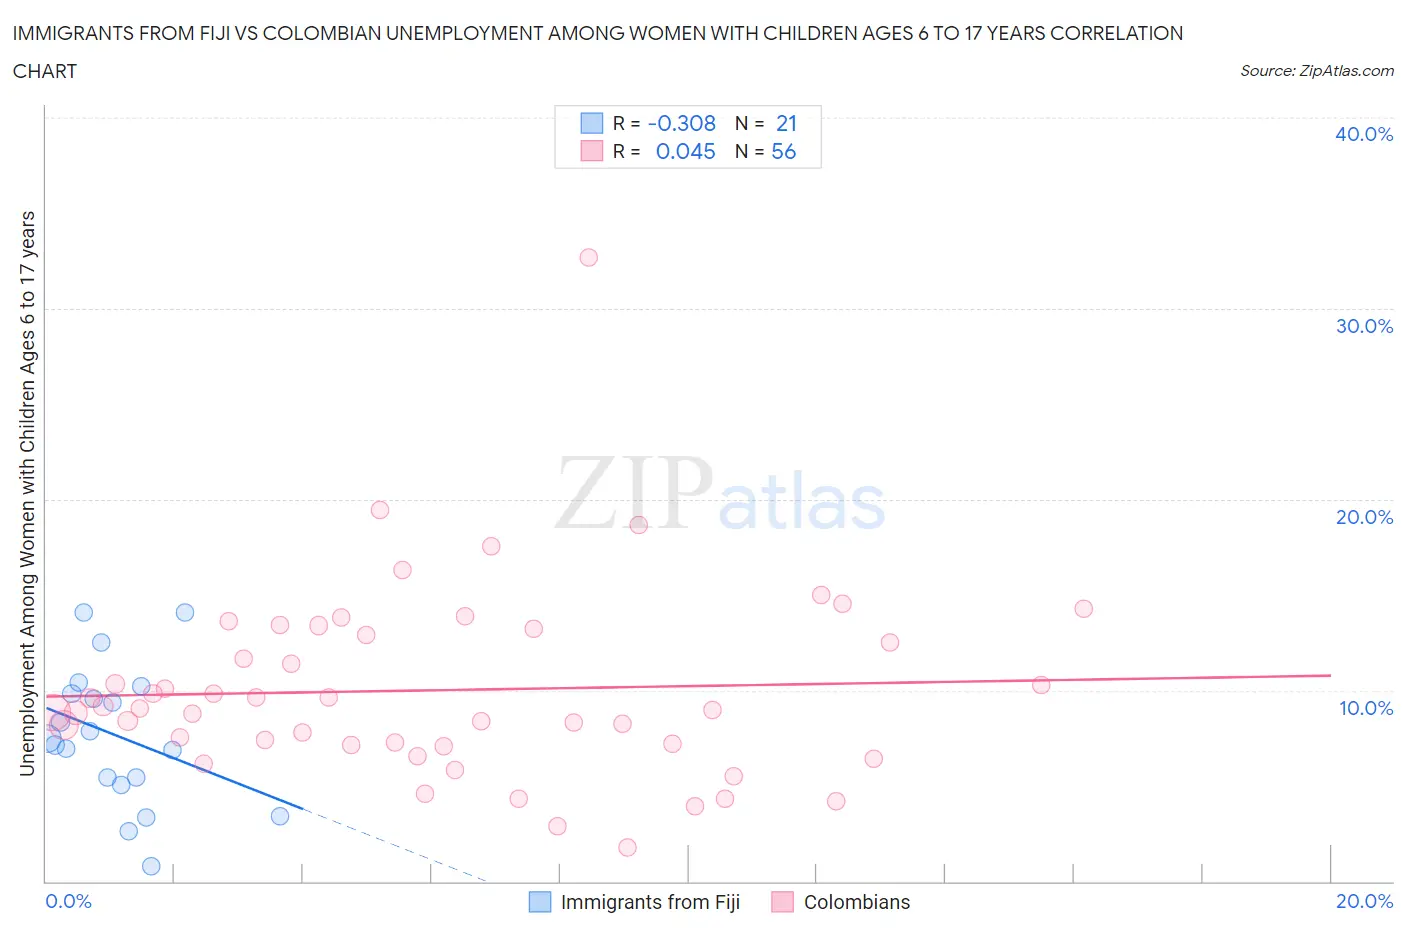
Immigrants from Fiji vs Colombian Unemployment Among Women with Children Ages 6 to 17 years Correlation Chart
The statistical analysis conducted on geographies consisting of 84,843,445 people shows a mild negative correlation between the proportion of Immigrants from Fiji and unemployment rate among women with children between the ages 6 and 17 in the United States with a correlation coefficient (R) of -0.308 and weighted average of 7.3%. Similarly, the statistical analysis conducted on geographies consisting of 301,134,838 people shows no correlation between the proportion of Colombians and unemployment rate among women with children between the ages 6 and 17 in the United States with a correlation coefficient (R) of 0.045 and weighted average of 9.3%, a difference of 28.4%.
Unemployment Among Women with Children Ages 6 to 17 years Correlation Summary
| Measurement | Immigrants from Fiji | Colombian |
| Minimum | 0.80% | 1.8% |
| Maximum | 14.1% | 32.7% |
| Range | 13.3% | 30.9% |
| Mean | 7.6% | 10.0% |
| Median | 7.5% | 9.0% |
| Interquartile 25% (IQ1) | 5.2% | 7.2% |
| Interquartile 75% (IQ3) | 10.0% | 13.1% |
| Interquartile Range (IQR) | 4.8% | 5.9% |
| Standard Deviation (Sample) | 3.6% | 5.0% |
| Standard Deviation (Population) | 3.5% | 4.9% |
Similar Demographics by Unemployment Among Women with Children Ages 6 to 17 years
Demographics Similar to Immigrants from Fiji by Unemployment Among Women with Children Ages 6 to 17 years
In terms of unemployment among women with children ages 6 to 17 years, the demographic groups most similar to Immigrants from Fiji are Immigrants from Taiwan (7.3%, a difference of 0.70%), Assyrian/Chaldean/Syriac (7.2%, a difference of 0.97%), Bangladeshi (7.4%, a difference of 1.0%), Immigrants from Hong Kong (7.2%, a difference of 1.3%), and Indonesian (7.4%, a difference of 1.7%).
| Demographics | Rating | Rank | Unemployment Among Women with Children Ages 6 to 17 years |
| Tongans | 100.0 /100 | #3 | Exceptional 6.7% |
| Ute | 100.0 /100 | #4 | Exceptional 7.0% |
| Okinawans | 100.0 /100 | #5 | Exceptional 7.0% |
| Tlingit-Haida | 100.0 /100 | #6 | Exceptional 7.1% |
| Soviet Union | 100.0 /100 | #7 | Exceptional 7.1% |
| Immigrants | Hong Kong | 100.0 /100 | #8 | Exceptional 7.2% |
| Assyrians/Chaldeans/Syriacs | 100.0 /100 | #9 | Exceptional 7.2% |
| Immigrants | Fiji | 100.0 /100 | #10 | Exceptional 7.3% |
| Immigrants | Taiwan | 100.0 /100 | #11 | Exceptional 7.3% |
| Bangladeshis | 100.0 /100 | #12 | Exceptional 7.4% |
| Indonesians | 100.0 /100 | #13 | Exceptional 7.4% |
| Sudanese | 100.0 /100 | #14 | Exceptional 7.4% |
| Puget Sound Salish | 100.0 /100 | #15 | Exceptional 7.5% |
| Immigrants | Burma/Myanmar | 100.0 /100 | #16 | Exceptional 7.5% |
| Cambodians | 100.0 /100 | #17 | Exceptional 7.5% |
Demographics Similar to Colombians by Unemployment Among Women with Children Ages 6 to 17 years
In terms of unemployment among women with children ages 6 to 17 years, the demographic groups most similar to Colombians are Immigrants from Colombia (9.3%, a difference of 0.020%), Guatemalan (9.3%, a difference of 0.070%), Scottish (9.4%, a difference of 0.11%), English (9.4%, a difference of 0.16%), and Immigrants from Cameroon (9.4%, a difference of 0.19%).
| Demographics | Rating | Rank | Unemployment Among Women with Children Ages 6 to 17 years |
| Mexicans | 3.2 /100 | #234 | Tragic 9.3% |
| Uruguayans | 3.0 /100 | #235 | Tragic 9.3% |
| Hungarians | 3.0 /100 | #236 | Tragic 9.3% |
| Immigrants | Belize | 2.8 /100 | #237 | Tragic 9.3% |
| Arabs | 2.7 /100 | #238 | Tragic 9.3% |
| Immigrants | Saudi Arabia | 2.7 /100 | #239 | Tragic 9.3% |
| Guatemalans | 2.3 /100 | #240 | Tragic 9.3% |
| Colombians | 2.2 /100 | #241 | Tragic 9.3% |
| Immigrants | Colombia | 2.1 /100 | #242 | Tragic 9.3% |
| Scottish | 2.0 /100 | #243 | Tragic 9.4% |
| English | 1.9 /100 | #244 | Tragic 9.4% |
| Immigrants | Cameroon | 1.8 /100 | #245 | Tragic 9.4% |
| Immigrants | Africa | 1.6 /100 | #246 | Tragic 9.4% |
| Poles | 1.5 /100 | #247 | Tragic 9.4% |
| Dutch | 1.5 /100 | #248 | Tragic 9.4% |