Immigrants from Dominican Republic vs White/Caucasian Unemployment Among Youth under 25 years
COMPARE
Immigrants from Dominican Republic
White/Caucasian
Unemployment Among Youth under 25 years
Unemployment Among Youth under 25 years Comparison
Immigrants from Dominican Republic
Whites/Caucasians
15.6%
UNEMPLOYMENT AMONG YOUTH UNDER 25 YEARS
0.0/ 100
METRIC RATING
328th/ 347
METRIC RANK
11.2%
UNEMPLOYMENT AMONG YOUTH UNDER 25 YEARS
96.9/ 100
METRIC RATING
77th/ 347
METRIC RANK
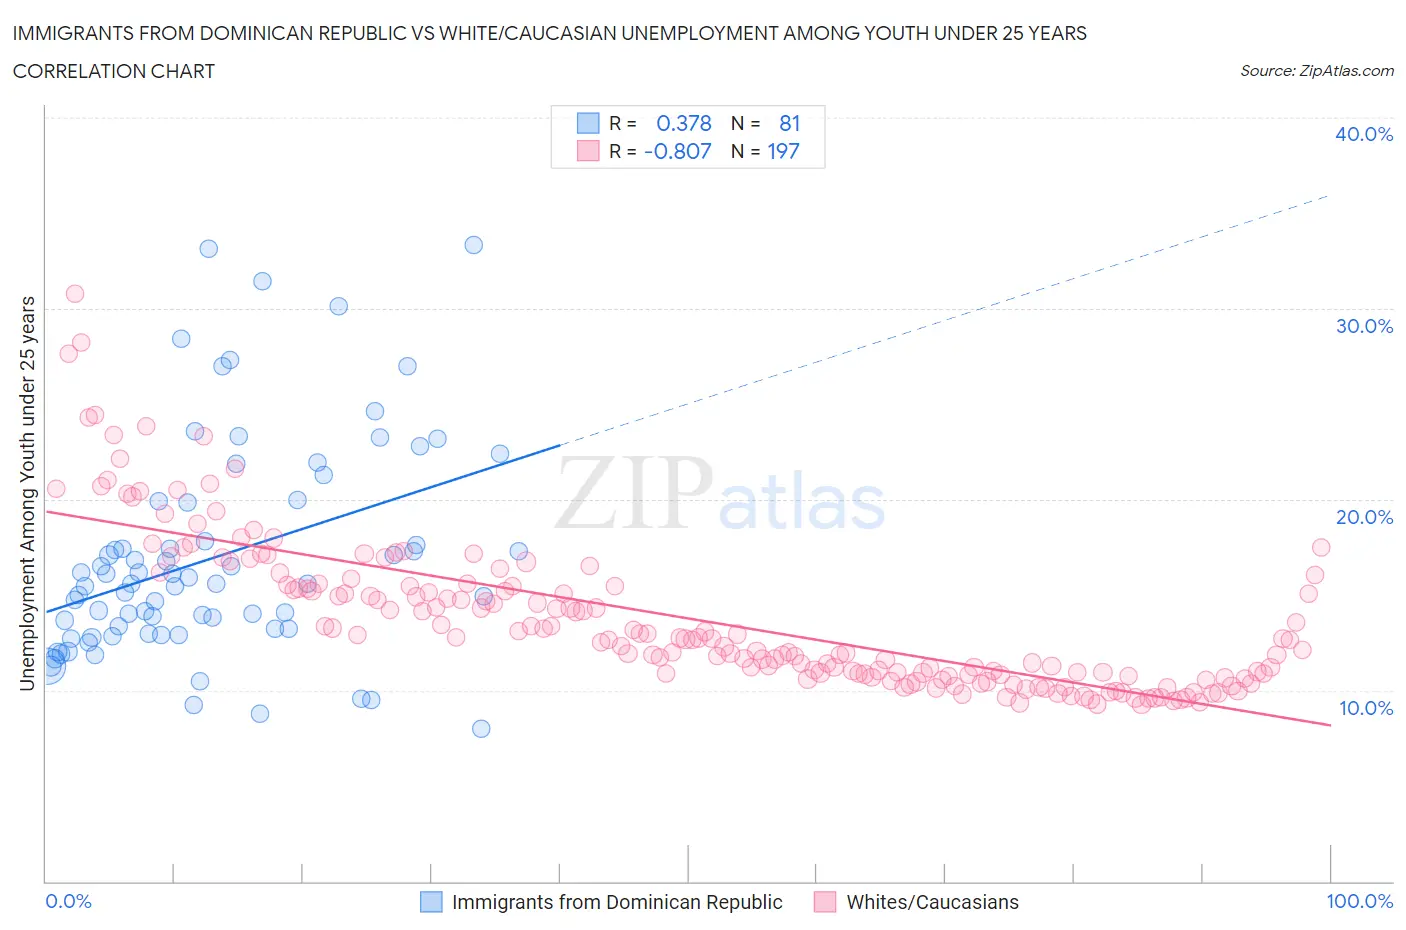
Immigrants from Dominican Republic vs White/Caucasian Unemployment Among Youth under 25 years Correlation Chart
The statistical analysis conducted on geographies consisting of 272,581,719 people shows a mild positive correlation between the proportion of Immigrants from Dominican Republic and unemployment rate among youth under the age of 25 in the United States with a correlation coefficient (R) of 0.378 and weighted average of 15.6%. Similarly, the statistical analysis conducted on geographies consisting of 555,079,229 people shows a very strong negative correlation between the proportion of Whites/Caucasians and unemployment rate among youth under the age of 25 in the United States with a correlation coefficient (R) of -0.807 and weighted average of 11.2%, a difference of 39.0%.
Unemployment Among Youth under 25 years Correlation Summary
| Measurement | Immigrants from Dominican Republic | White/Caucasian |
| Minimum | 8.0% | 9.2% |
| Maximum | 33.3% | 30.8% |
| Range | 25.3% | 21.5% |
| Mean | 17.0% | 13.7% |
| Median | 15.6% | 12.7% |
| Interquartile 25% (IQ1) | 13.1% | 10.8% |
| Interquartile 75% (IQ3) | 19.9% | 15.5% |
| Interquartile Range (IQR) | 6.8% | 4.7% |
| Standard Deviation (Sample) | 5.7% | 4.0% |
| Standard Deviation (Population) | 5.6% | 3.9% |
Similar Demographics by Unemployment Among Youth under 25 years
Demographics Similar to Immigrants from Dominican Republic by Unemployment Among Youth under 25 years
In terms of unemployment among youth under 25 years, the demographic groups most similar to Immigrants from Dominican Republic are British West Indian (15.5%, a difference of 0.11%), Immigrants from Yemen (15.6%, a difference of 0.13%), Yakama (15.6%, a difference of 0.17%), Dominican (15.7%, a difference of 1.0%), and Immigrants from Grenada (15.8%, a difference of 1.7%).
| Demographics | Rating | Rank | Unemployment Among Youth under 25 years |
| Cheyenne | 0.0 /100 | #321 | Tragic 14.6% |
| Trinidadians and Tobagonians | 0.0 /100 | #322 | Tragic 14.6% |
| Immigrants | Trinidad and Tobago | 0.0 /100 | #323 | Tragic 14.6% |
| Immigrants | Jamaica | 0.0 /100 | #324 | Tragic 14.8% |
| Alaska Natives | 0.0 /100 | #325 | Tragic 14.9% |
| Immigrants | Barbados | 0.0 /100 | #326 | Tragic 15.2% |
| British West Indians | 0.0 /100 | #327 | Tragic 15.5% |
| Immigrants | Dominican Republic | 0.0 /100 | #328 | Tragic 15.6% |
| Immigrants | Yemen | 0.0 /100 | #329 | Tragic 15.6% |
| Yakama | 0.0 /100 | #330 | Tragic 15.6% |
| Dominicans | 0.0 /100 | #331 | Tragic 15.7% |
| Immigrants | Grenada | 0.0 /100 | #332 | Tragic 15.8% |
| Guyanese | 0.0 /100 | #333 | Tragic 15.9% |
| Immigrants | Guyana | 0.0 /100 | #334 | Tragic 15.9% |
| Immigrants | St. Vincent and the Grenadines | 0.0 /100 | #335 | Tragic 16.1% |
Demographics Similar to Whites/Caucasians by Unemployment Among Youth under 25 years
In terms of unemployment among youth under 25 years, the demographic groups most similar to Whites/Caucasians are German Russian (11.2%, a difference of 0.050%), Immigrants from Nicaragua (11.2%, a difference of 0.060%), Immigrants from Canada (11.2%, a difference of 0.070%), French (11.2%, a difference of 0.080%), and New Zealander (11.2%, a difference of 0.11%).
| Demographics | Rating | Rank | Unemployment Among Youth under 25 years |
| Slavs | 97.5 /100 | #70 | Exceptional 11.2% |
| Bhutanese | 97.4 /100 | #71 | Exceptional 11.2% |
| Immigrants | Australia | 97.3 /100 | #72 | Exceptional 11.2% |
| Creek | 97.2 /100 | #73 | Exceptional 11.2% |
| New Zealanders | 97.2 /100 | #74 | Exceptional 11.2% |
| French | 97.1 /100 | #75 | Exceptional 11.2% |
| German Russians | 97.0 /100 | #76 | Exceptional 11.2% |
| Whites/Caucasians | 96.9 /100 | #77 | Exceptional 11.2% |
| Immigrants | Nicaragua | 96.7 /100 | #78 | Exceptional 11.2% |
| Immigrants | Canada | 96.7 /100 | #79 | Exceptional 11.2% |
| Immigrants | Bulgaria | 96.4 /100 | #80 | Exceptional 11.2% |
| Icelanders | 96.3 /100 | #81 | Exceptional 11.2% |
| Northern Europeans | 96.2 /100 | #82 | Exceptional 11.2% |
| Bolivians | 96.1 /100 | #83 | Exceptional 11.2% |
| French Canadians | 95.9 /100 | #84 | Exceptional 11.2% |