Immigrants from Eritrea vs Albanian Male Unemployment
COMPARE
Immigrants from Eritrea
Albanian
Male Unemployment
Male Unemployment Comparison
Immigrants from Eritrea
Albanians
5.0%
MALE UNEMPLOYMENT
96.0/ 100
METRIC RATING
83rd/ 347
METRIC RANK
5.4%
MALE UNEMPLOYMENT
17.3/ 100
METRIC RATING
196th/ 347
METRIC RANK
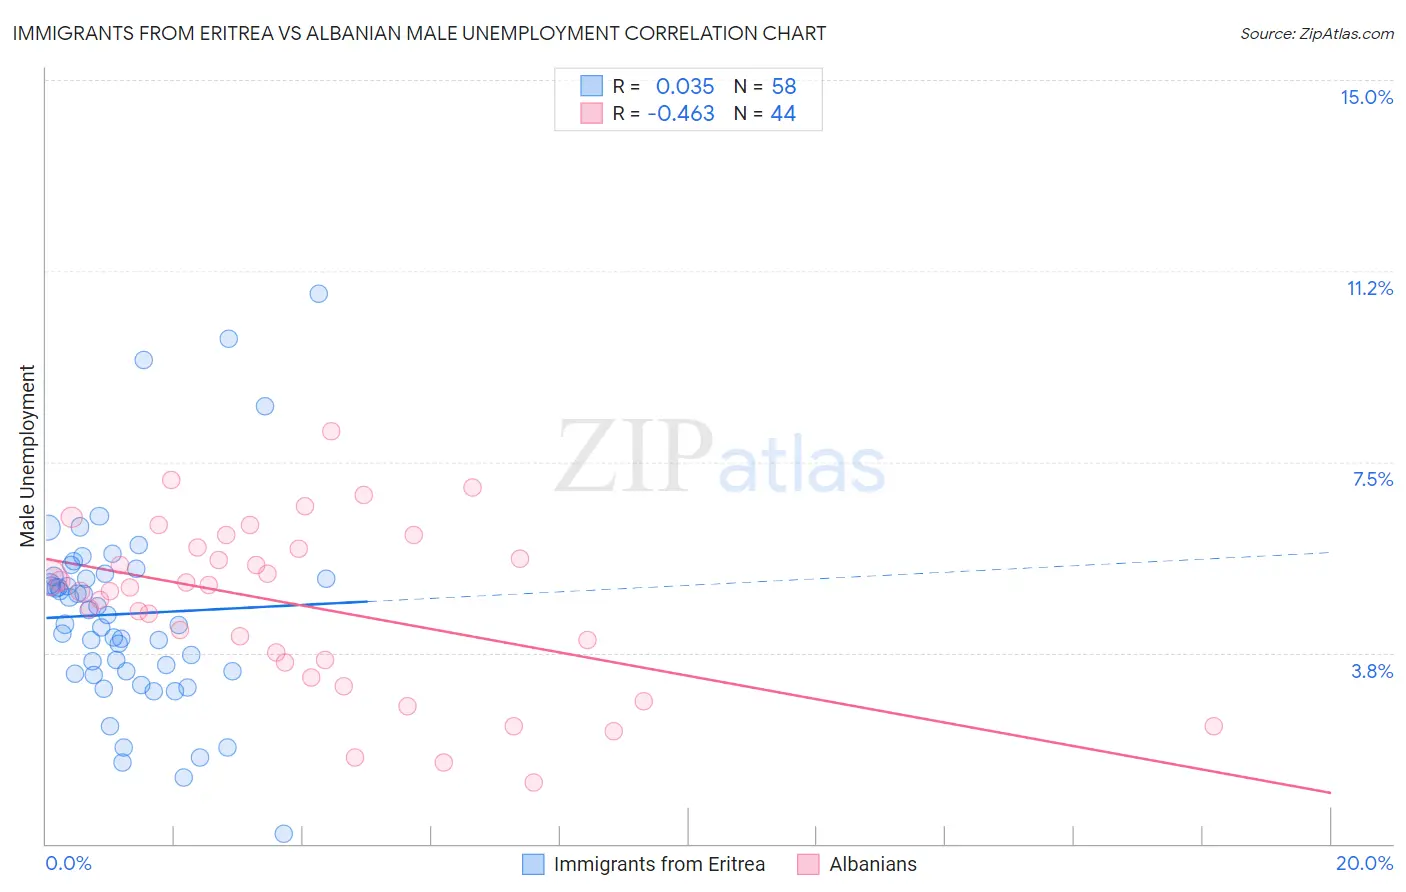
Immigrants from Eritrea vs Albanian Male Unemployment Correlation Chart
The statistical analysis conducted on geographies consisting of 104,807,981 people shows no correlation between the proportion of Immigrants from Eritrea and unemployment rate among males in the United States with a correlation coefficient (R) of 0.035 and weighted average of 5.0%. Similarly, the statistical analysis conducted on geographies consisting of 192,976,044 people shows a moderate negative correlation between the proportion of Albanians and unemployment rate among males in the United States with a correlation coefficient (R) of -0.463 and weighted average of 5.4%, a difference of 7.3%.
Male Unemployment Correlation Summary
| Measurement | Immigrants from Eritrea | Albanian |
| Minimum | 0.20% | 1.2% |
| Maximum | 10.8% | 8.1% |
| Range | 10.6% | 6.9% |
| Mean | 4.5% | 4.7% |
| Median | 4.4% | 5.0% |
| Interquartile 25% (IQ1) | 3.4% | 3.6% |
| Interquartile 75% (IQ3) | 5.3% | 5.8% |
| Interquartile Range (IQR) | 1.9% | 2.2% |
| Standard Deviation (Sample) | 1.9% | 1.6% |
| Standard Deviation (Population) | 1.9% | 1.6% |
Similar Demographics by Male Unemployment
Demographics Similar to Immigrants from Eritrea by Male Unemployment
In terms of male unemployment, the demographic groups most similar to Immigrants from Eritrea are Chilean (5.0%, a difference of 0.060%), Argentinean (5.0%, a difference of 0.090%), French (5.0%, a difference of 0.090%), Serbian (5.1%, a difference of 0.12%), and South African (5.0%, a difference of 0.14%).
| Demographics | Rating | Rank | Male Unemployment |
| Immigrants | Sudan | 96.5 /100 | #76 | Exceptional 5.0% |
| Iranians | 96.4 /100 | #77 | Exceptional 5.0% |
| Immigrants | Northern Europe | 96.4 /100 | #78 | Exceptional 5.0% |
| South Africans | 96.4 /100 | #79 | Exceptional 5.0% |
| Argentineans | 96.2 /100 | #80 | Exceptional 5.0% |
| French | 96.2 /100 | #81 | Exceptional 5.0% |
| Chileans | 96.2 /100 | #82 | Exceptional 5.0% |
| Immigrants | Eritrea | 96.0 /100 | #83 | Exceptional 5.0% |
| Serbians | 95.7 /100 | #84 | Exceptional 5.1% |
| Immigrants | North Macedonia | 95.6 /100 | #85 | Exceptional 5.1% |
| Maltese | 95.5 /100 | #86 | Exceptional 5.1% |
| Immigrants | Romania | 95.4 /100 | #87 | Exceptional 5.1% |
| Immigrants | Sri Lanka | 94.9 /100 | #88 | Exceptional 5.1% |
| Immigrants | Australia | 94.7 /100 | #89 | Exceptional 5.1% |
| Okinawans | 94.7 /100 | #90 | Exceptional 5.1% |
Demographics Similar to Albanians by Male Unemployment
In terms of male unemployment, the demographic groups most similar to Albanians are Immigrants from Southern Europe (5.4%, a difference of 0.040%), Alsatian (5.4%, a difference of 0.060%), Spanish (5.4%, a difference of 0.22%), Immigrants from Thailand (5.4%, a difference of 0.28%), and Immigrants from Greece (5.4%, a difference of 0.30%).
| Demographics | Rating | Rank | Male Unemployment |
| Immigrants | South America | 29.4 /100 | #189 | Fair 5.4% |
| Immigrants | Uganda | 28.8 /100 | #190 | Fair 5.4% |
| Immigrants | South Eastern Asia | 28.2 /100 | #191 | Fair 5.4% |
| Immigrants | Belarus | 26.0 /100 | #192 | Fair 5.4% |
| Immigrants | Israel | 25.2 /100 | #193 | Fair 5.4% |
| Spanish | 19.7 /100 | #194 | Poor 5.4% |
| Immigrants | Southern Europe | 17.7 /100 | #195 | Poor 5.4% |
| Albanians | 17.3 /100 | #196 | Poor 5.4% |
| Alsatians | 16.7 /100 | #197 | Poor 5.4% |
| Immigrants | Thailand | 14.7 /100 | #198 | Poor 5.4% |
| Immigrants | Greece | 14.5 /100 | #199 | Poor 5.4% |
| Immigrants | Zaire | 13.7 /100 | #200 | Poor 5.4% |
| Immigrants | Philippines | 13.5 /100 | #201 | Poor 5.4% |
| Immigrants | Nonimmigrants | 13.1 /100 | #202 | Poor 5.4% |
| Immigrants | Laos | 13.0 /100 | #203 | Poor 5.4% |