Immigrants from Eritrea vs Ute Male Unemployment
COMPARE
Immigrants from Eritrea
Ute
Male Unemployment
Male Unemployment Comparison
Immigrants from Eritrea
Ute
5.0%
MALE UNEMPLOYMENT
96.0/ 100
METRIC RATING
83rd/ 347
METRIC RANK
6.6%
MALE UNEMPLOYMENT
0.0/ 100
METRIC RATING
302nd/ 347
METRIC RANK
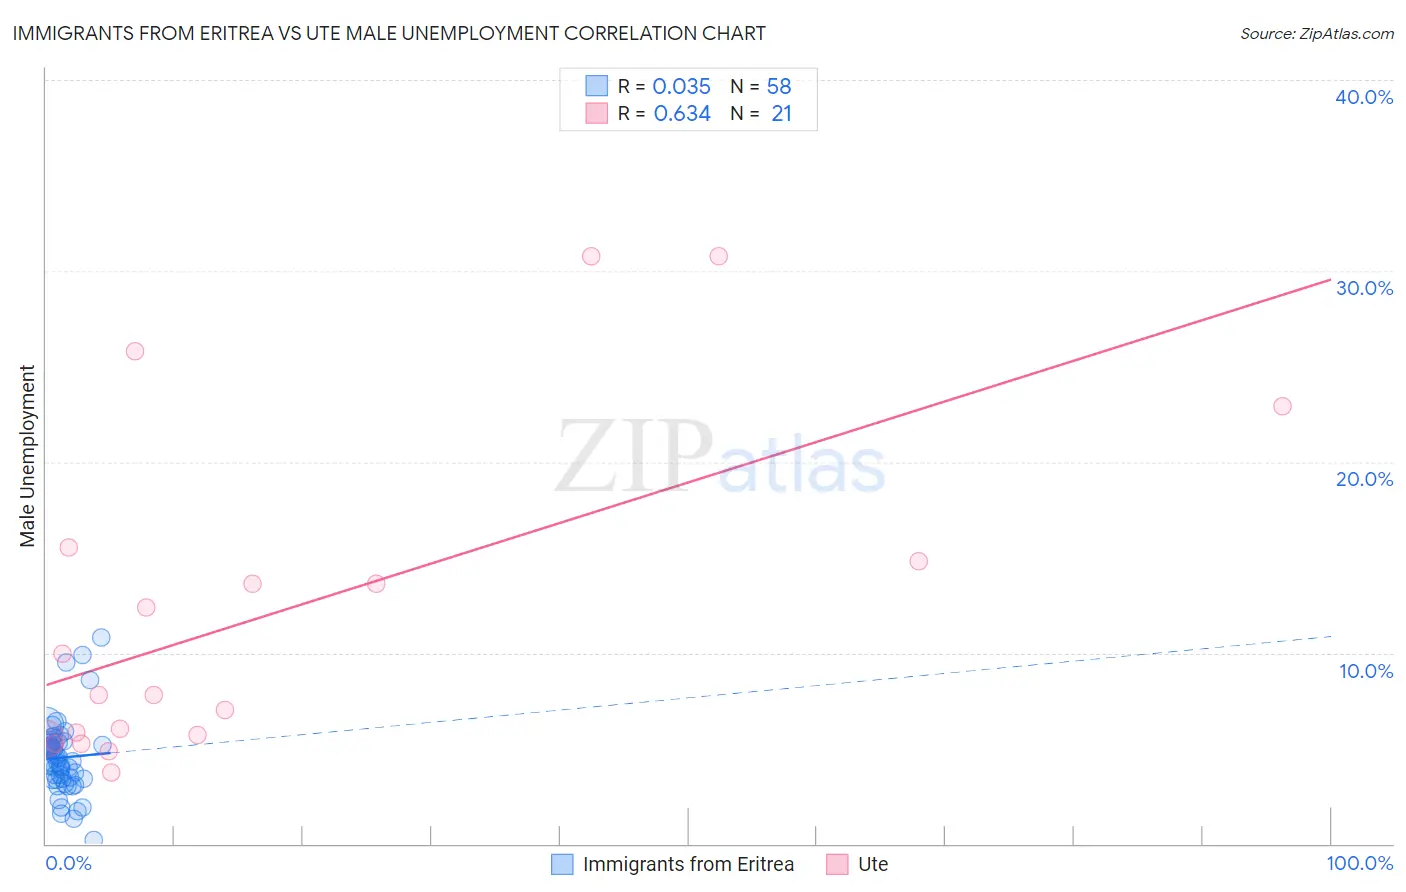
Immigrants from Eritrea vs Ute Male Unemployment Correlation Chart
The statistical analysis conducted on geographies consisting of 104,807,981 people shows no correlation between the proportion of Immigrants from Eritrea and unemployment rate among males in the United States with a correlation coefficient (R) of 0.035 and weighted average of 5.0%. Similarly, the statistical analysis conducted on geographies consisting of 55,563,809 people shows a significant positive correlation between the proportion of Ute and unemployment rate among males in the United States with a correlation coefficient (R) of 0.634 and weighted average of 6.6%, a difference of 31.5%.
Male Unemployment Correlation Summary
| Measurement | Immigrants from Eritrea | Ute |
| Minimum | 0.20% | 3.7% |
| Maximum | 10.8% | 30.8% |
| Range | 10.6% | 27.1% |
| Mean | 4.5% | 12.1% |
| Median | 4.4% | 7.8% |
| Interquartile 25% (IQ1) | 3.4% | 5.6% |
| Interquartile 75% (IQ3) | 5.3% | 15.2% |
| Interquartile Range (IQR) | 1.9% | 9.6% |
| Standard Deviation (Sample) | 1.9% | 8.6% |
| Standard Deviation (Population) | 1.9% | 8.4% |
Similar Demographics by Male Unemployment
Demographics Similar to Immigrants from Eritrea by Male Unemployment
In terms of male unemployment, the demographic groups most similar to Immigrants from Eritrea are Chilean (5.0%, a difference of 0.060%), Argentinean (5.0%, a difference of 0.090%), French (5.0%, a difference of 0.090%), Serbian (5.1%, a difference of 0.12%), and South African (5.0%, a difference of 0.14%).
| Demographics | Rating | Rank | Male Unemployment |
| Immigrants | Sudan | 96.5 /100 | #76 | Exceptional 5.0% |
| Iranians | 96.4 /100 | #77 | Exceptional 5.0% |
| Immigrants | Northern Europe | 96.4 /100 | #78 | Exceptional 5.0% |
| South Africans | 96.4 /100 | #79 | Exceptional 5.0% |
| Argentineans | 96.2 /100 | #80 | Exceptional 5.0% |
| French | 96.2 /100 | #81 | Exceptional 5.0% |
| Chileans | 96.2 /100 | #82 | Exceptional 5.0% |
| Immigrants | Eritrea | 96.0 /100 | #83 | Exceptional 5.0% |
| Serbians | 95.7 /100 | #84 | Exceptional 5.1% |
| Immigrants | North Macedonia | 95.6 /100 | #85 | Exceptional 5.1% |
| Maltese | 95.5 /100 | #86 | Exceptional 5.1% |
| Immigrants | Romania | 95.4 /100 | #87 | Exceptional 5.1% |
| Immigrants | Sri Lanka | 94.9 /100 | #88 | Exceptional 5.1% |
| Immigrants | Australia | 94.7 /100 | #89 | Exceptional 5.1% |
| Okinawans | 94.7 /100 | #90 | Exceptional 5.1% |
Demographics Similar to Ute by Male Unemployment
In terms of male unemployment, the demographic groups most similar to Ute are Immigrants from West Indies (6.7%, a difference of 0.36%), West Indian (6.7%, a difference of 0.37%), Trinidadian and Tobagonian (6.7%, a difference of 0.69%), Immigrants from Belize (6.6%, a difference of 0.71%), and Vietnamese (6.6%, a difference of 0.82%).
| Demographics | Rating | Rank | Male Unemployment |
| Belizeans | 0.0 /100 | #295 | Tragic 6.5% |
| Immigrants | Haiti | 0.0 /100 | #296 | Tragic 6.5% |
| Chippewa | 0.0 /100 | #297 | Tragic 6.6% |
| Jamaicans | 0.0 /100 | #298 | Tragic 6.6% |
| Immigrants | Bangladesh | 0.0 /100 | #299 | Tragic 6.6% |
| Vietnamese | 0.0 /100 | #300 | Tragic 6.6% |
| Immigrants | Belize | 0.0 /100 | #301 | Tragic 6.6% |
| Ute | 0.0 /100 | #302 | Tragic 6.6% |
| Immigrants | West Indies | 0.0 /100 | #303 | Tragic 6.7% |
| West Indians | 0.0 /100 | #304 | Tragic 6.7% |
| Trinidadians and Tobagonians | 0.0 /100 | #305 | Tragic 6.7% |
| Immigrants | Trinidad and Tobago | 0.0 /100 | #306 | Tragic 6.7% |
| Immigrants | Jamaica | 0.0 /100 | #307 | Tragic 6.7% |
| Aleuts | 0.0 /100 | #308 | Tragic 6.8% |
| Barbadians | 0.0 /100 | #309 | Tragic 6.9% |