New Zealander vs Carpatho Rusyn Unemployment Among Ages 35 to 44 years
COMPARE
New Zealander
Carpatho Rusyn
Unemployment Among Ages 35 to 44 years
Unemployment Among Ages 35 to 44 years Comparison
New Zealanders
Carpatho Rusyns
4.5%
UNEMPLOYMENT AMONG AGES 35 TO 44 YEARS
90.3/ 100
METRIC RATING
108th/ 347
METRIC RANK
4.3%
UNEMPLOYMENT AMONG AGES 35 TO 44 YEARS
99.2/ 100
METRIC RATING
31st/ 347
METRIC RANK
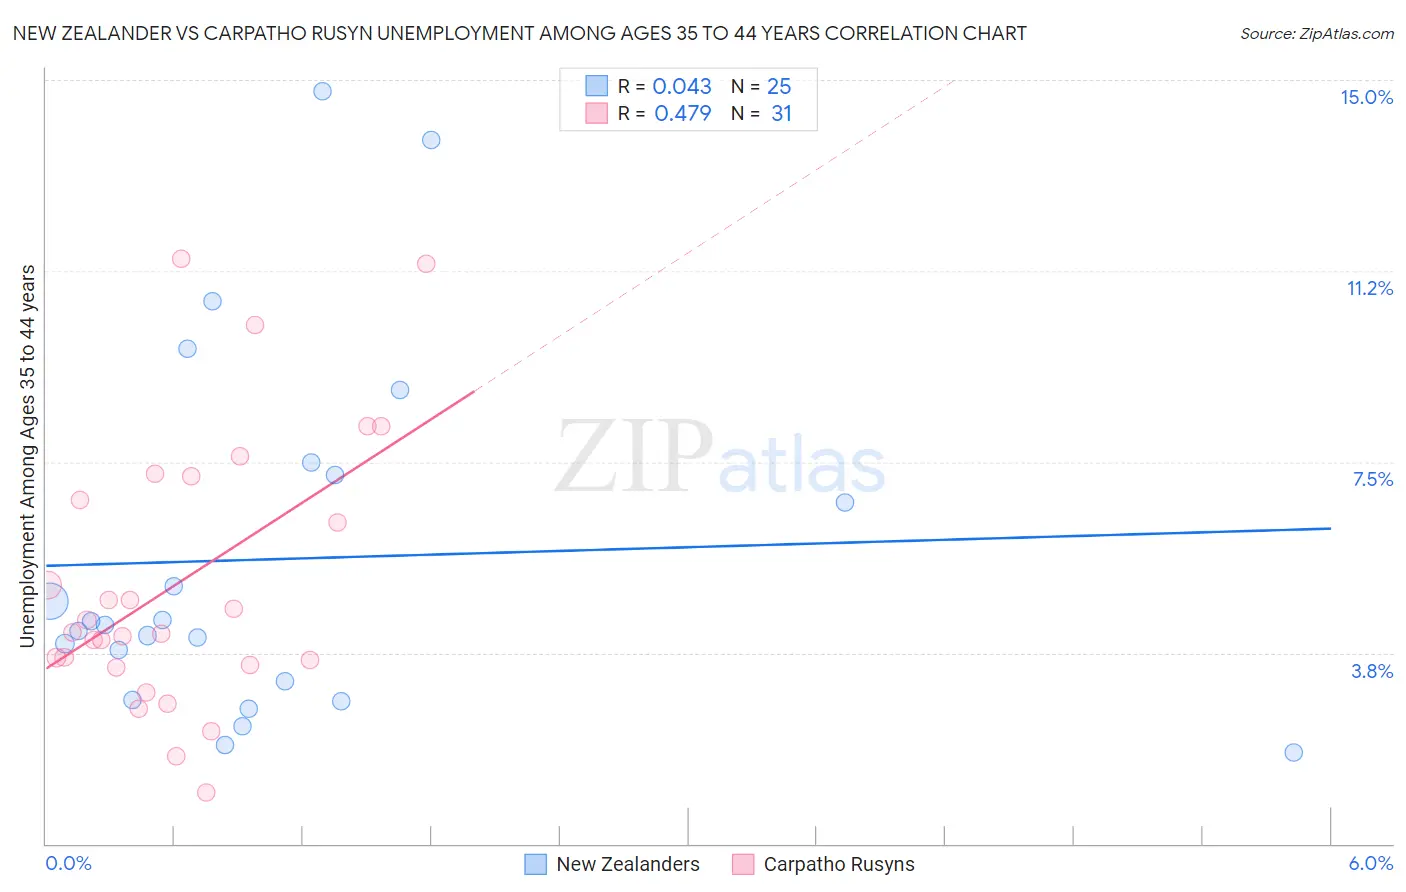
New Zealander vs Carpatho Rusyn Unemployment Among Ages 35 to 44 years Correlation Chart
The statistical analysis conducted on geographies consisting of 106,194,191 people shows no correlation between the proportion of New Zealanders and unemployment rate among population between the ages 35 and 44 in the United States with a correlation coefficient (R) of 0.043 and weighted average of 4.5%. Similarly, the statistical analysis conducted on geographies consisting of 58,444,896 people shows a moderate positive correlation between the proportion of Carpatho Rusyns and unemployment rate among population between the ages 35 and 44 in the United States with a correlation coefficient (R) of 0.479 and weighted average of 4.3%, a difference of 4.9%.
Unemployment Among Ages 35 to 44 years Correlation Summary
| Measurement | New Zealander | Carpatho Rusyn |
| Minimum | 1.8% | 1.0% |
| Maximum | 14.8% | 11.5% |
| Range | 13.0% | 10.5% |
| Mean | 5.6% | 5.2% |
| Median | 4.3% | 4.2% |
| Interquartile 25% (IQ1) | 3.0% | 3.5% |
| Interquartile 75% (IQ3) | 7.4% | 7.2% |
| Interquartile Range (IQR) | 4.4% | 3.7% |
| Standard Deviation (Sample) | 3.5% | 2.7% |
| Standard Deviation (Population) | 3.5% | 2.6% |
Similar Demographics by Unemployment Among Ages 35 to 44 years
Demographics Similar to New Zealanders by Unemployment Among Ages 35 to 44 years
In terms of unemployment among ages 35 to 44 years, the demographic groups most similar to New Zealanders are Romanian (4.5%, a difference of 0.0%), Immigrants from Kazakhstan (4.5%, a difference of 0.070%), Immigrants from North Macedonia (4.5%, a difference of 0.090%), Immigrants from Nicaragua (4.5%, a difference of 0.10%), and Immigrants from North America (4.5%, a difference of 0.18%).
| Demographics | Rating | Rank | Unemployment Among Ages 35 to 44 years |
| Immigrants | Netherlands | 91.9 /100 | #101 | Exceptional 4.5% |
| Immigrants | Sudan | 91.8 /100 | #102 | Exceptional 4.5% |
| Welsh | 91.6 /100 | #103 | Exceptional 4.5% |
| Finns | 91.6 /100 | #104 | Exceptional 4.5% |
| Immigrants | Saudi Arabia | 91.3 /100 | #105 | Exceptional 4.5% |
| Immigrants | North America | 91.1 /100 | #106 | Exceptional 4.5% |
| Immigrants | North Macedonia | 90.7 /100 | #107 | Exceptional 4.5% |
| New Zealanders | 90.3 /100 | #108 | Exceptional 4.5% |
| Romanians | 90.3 /100 | #109 | Exceptional 4.5% |
| Immigrants | Kazakhstan | 90.0 /100 | #110 | Excellent 4.5% |
| Immigrants | Nicaragua | 89.8 /100 | #111 | Excellent 4.5% |
| Immigrants | Czechoslovakia | 89.2 /100 | #112 | Excellent 4.5% |
| Immigrants | Italy | 88.4 /100 | #113 | Excellent 4.5% |
| Macedonians | 88.3 /100 | #114 | Excellent 4.5% |
| Maltese | 88.1 /100 | #115 | Excellent 4.5% |
Demographics Similar to Carpatho Rusyns by Unemployment Among Ages 35 to 44 years
In terms of unemployment among ages 35 to 44 years, the demographic groups most similar to Carpatho Rusyns are Immigrants from Pakistan (4.3%, a difference of 0.040%), Chinese (4.3%, a difference of 0.10%), European (4.3%, a difference of 0.11%), Immigrants from Sri Lanka (4.3%, a difference of 0.20%), and Immigrants from Japan (4.3%, a difference of 0.30%).
| Demographics | Rating | Rank | Unemployment Among Ages 35 to 44 years |
| Tlingit-Haida | 99.5 /100 | #24 | Exceptional 4.3% |
| Bulgarians | 99.3 /100 | #25 | Exceptional 4.3% |
| Turks | 99.3 /100 | #26 | Exceptional 4.3% |
| Assyrians/Chaldeans/Syriacs | 99.3 /100 | #27 | Exceptional 4.3% |
| Immigrants | Japan | 99.3 /100 | #28 | Exceptional 4.3% |
| Europeans | 99.2 /100 | #29 | Exceptional 4.3% |
| Immigrants | Pakistan | 99.2 /100 | #30 | Exceptional 4.3% |
| Carpatho Rusyns | 99.2 /100 | #31 | Exceptional 4.3% |
| Chinese | 99.1 /100 | #32 | Exceptional 4.3% |
| Immigrants | Sri Lanka | 99.1 /100 | #33 | Exceptional 4.3% |
| Jordanians | 99.0 /100 | #34 | Exceptional 4.3% |
| Luxembourgers | 99.0 /100 | #35 | Exceptional 4.3% |
| Mongolians | 98.9 /100 | #36 | Exceptional 4.3% |
| Immigrants | Zimbabwe | 98.9 /100 | #37 | Exceptional 4.3% |
| Burmese | 98.9 /100 | #38 | Exceptional 4.3% |