Immigrants from Dominican Republic vs Potawatomi Family Households
COMPARE
Immigrants from Dominican Republic
Potawatomi
Family Households
Family Households Comparison
Immigrants from Dominican Republic
Potawatomi
63.3%
FAMILY HOUSEHOLDS
1.0/ 100
METRIC RATING
253rd/ 347
METRIC RANK
63.3%
FAMILY HOUSEHOLDS
1.0/ 100
METRIC RATING
255th/ 347
METRIC RANK
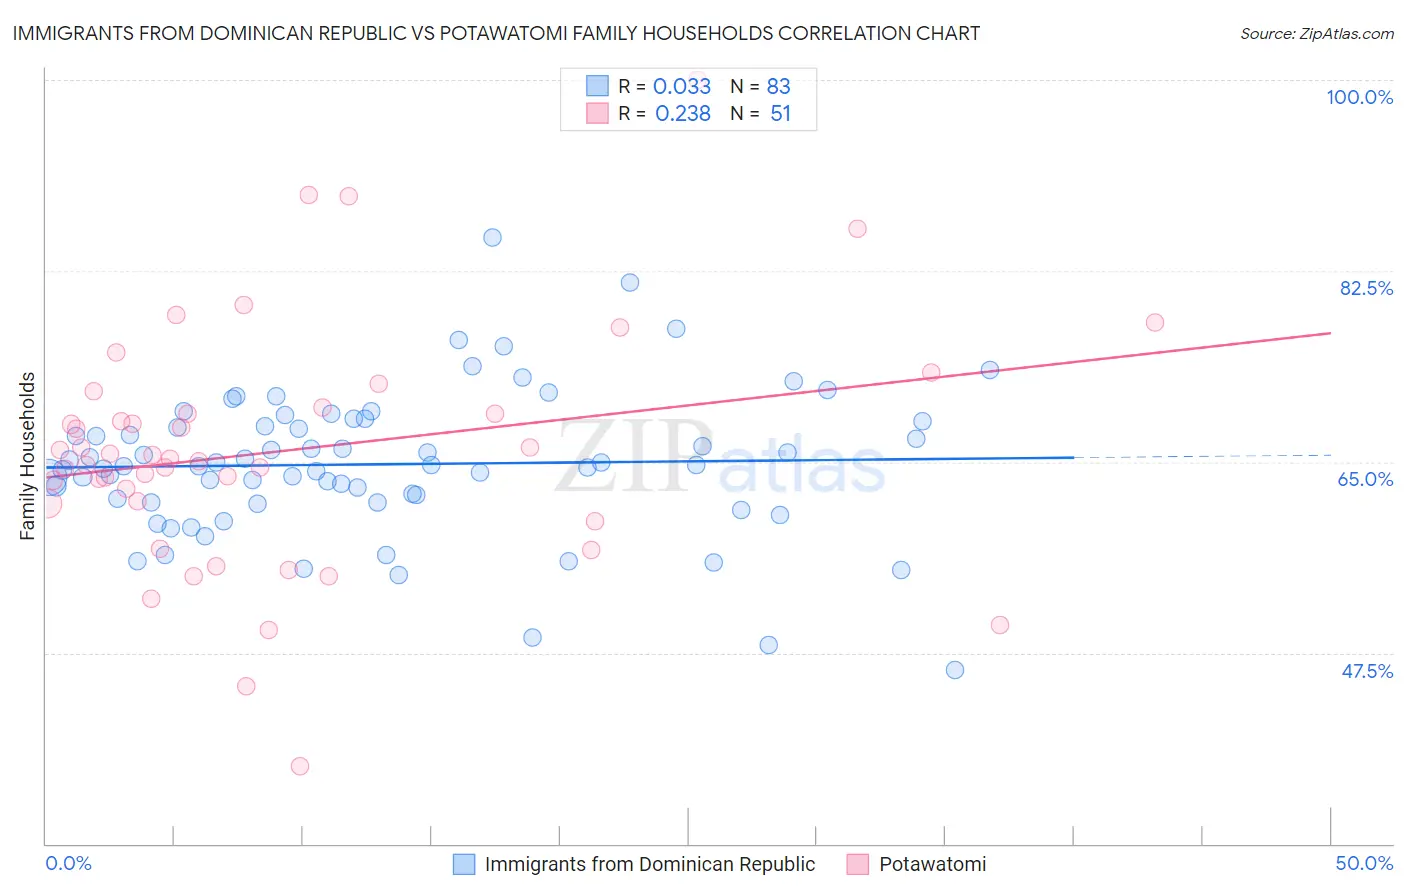
Immigrants from Dominican Republic vs Potawatomi Family Households Correlation Chart
The statistical analysis conducted on geographies consisting of 274,978,425 people shows no correlation between the proportion of Immigrants from Dominican Republic and percentage of family households in the United States with a correlation coefficient (R) of 0.033 and weighted average of 63.3%. Similarly, the statistical analysis conducted on geographies consisting of 117,759,902 people shows a weak positive correlation between the proportion of Potawatomi and percentage of family households in the United States with a correlation coefficient (R) of 0.238 and weighted average of 63.3%, a difference of 0.030%.
Family Households Correlation Summary
| Measurement | Immigrants from Dominican Republic | Potawatomi |
| Minimum | 46.0% | 37.1% |
| Maximum | 85.5% | 100.0% |
| Range | 39.6% | 62.9% |
| Mean | 64.8% | 66.1% |
| Median | 64.7% | 65.3% |
| Interquartile 25% (IQ1) | 61.3% | 61.2% |
| Interquartile 75% (IQ3) | 68.7% | 70.0% |
| Interquartile Range (IQR) | 7.4% | 8.8% |
| Standard Deviation (Sample) | 6.7% | 11.3% |
| Standard Deviation (Population) | 6.6% | 11.2% |
Demographics Similar to Immigrants from Dominican Republic and Potawatomi by Family Households
In terms of family households, the demographic groups most similar to Immigrants from Dominican Republic are Slovak (63.3%, a difference of 0.010%), Bahamian (63.3%, a difference of 0.020%), Taiwanese (63.3%, a difference of 0.040%), Luxembourger (63.3%, a difference of 0.050%), and Immigrants from Japan (63.4%, a difference of 0.090%). Similarly, the demographic groups most similar to Potawatomi are Slovak (63.3%, a difference of 0.020%), Luxembourger (63.3%, a difference of 0.020%), Bahamian (63.3%, a difference of 0.050%), Icelander (63.3%, a difference of 0.060%), and Taiwanese (63.3%, a difference of 0.070%).
| Demographics | Rating | Rank | Family Households |
| Eastern Europeans | 1.6 /100 | #244 | Tragic 63.4% |
| Immigrants | Dominica | 1.6 /100 | #245 | Tragic 63.4% |
| Immigrants | Ghana | 1.6 /100 | #246 | Tragic 63.4% |
| Immigrants | Uzbekistan | 1.5 /100 | #247 | Tragic 63.4% |
| Dominicans | 1.5 /100 | #248 | Tragic 63.4% |
| Russians | 1.4 /100 | #249 | Tragic 63.4% |
| Immigrants | Japan | 1.4 /100 | #250 | Tragic 63.4% |
| Taiwanese | 1.2 /100 | #251 | Tragic 63.3% |
| Bahamians | 1.1 /100 | #252 | Tragic 63.3% |
| Immigrants | Dominican Republic | 1.0 /100 | #253 | Tragic 63.3% |
| Slovaks | 1.0 /100 | #254 | Tragic 63.3% |
| Potawatomi | 1.0 /100 | #255 | Tragic 63.3% |
| Luxembourgers | 0.9 /100 | #256 | Tragic 63.3% |
| Icelanders | 0.8 /100 | #257 | Tragic 63.3% |
| Immigrants | Barbados | 0.7 /100 | #258 | Tragic 63.2% |
| Immigrants | Western Europe | 0.6 /100 | #259 | Tragic 63.2% |
| Cypriots | 0.6 /100 | #260 | Tragic 63.2% |
| Immigrants | Russia | 0.6 /100 | #261 | Tragic 63.2% |
| Immigrants | Ireland | 0.6 /100 | #262 | Tragic 63.2% |
| Cheyenne | 0.5 /100 | #263 | Tragic 63.2% |
| Kenyans | 0.5 /100 | #264 | Tragic 63.2% |