Swedish vs Potawatomi Female Unemployment
COMPARE
Swedish
Potawatomi
Female Unemployment
Female Unemployment Comparison
Swedes
Potawatomi
4.4%
FEMALE UNEMPLOYMENT
100.0/ 100
METRIC RATING
6th/ 347
METRIC RANK
5.2%
FEMALE UNEMPLOYMENT
65.9/ 100
METRIC RATING
162nd/ 347
METRIC RANK
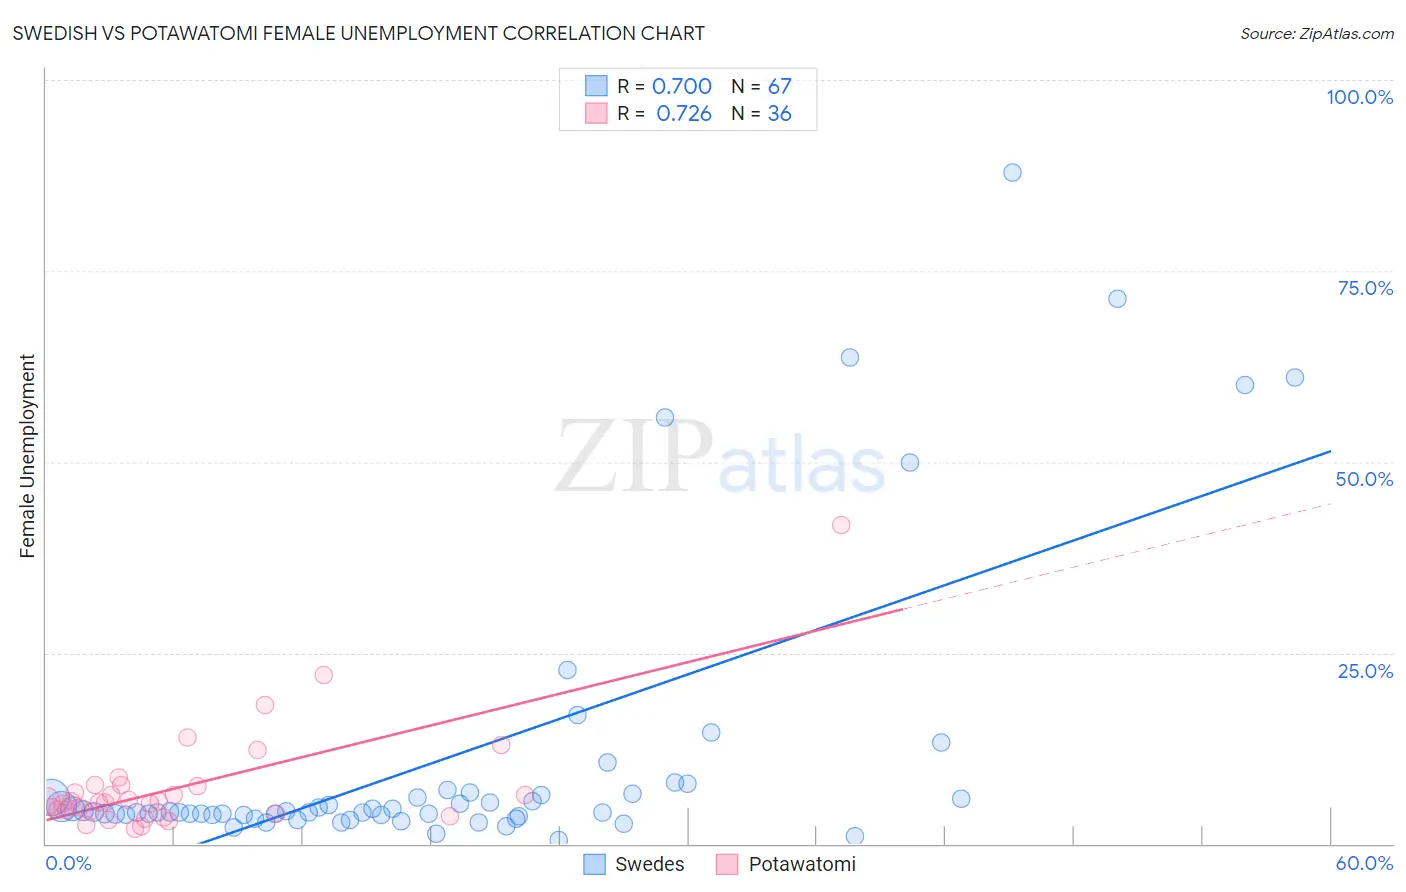
Swedish vs Potawatomi Female Unemployment Correlation Chart
The statistical analysis conducted on geographies consisting of 528,532,486 people shows a strong positive correlation between the proportion of Swedes and unemploymnet rate among females in the United States with a correlation coefficient (R) of 0.700 and weighted average of 4.4%. Similarly, the statistical analysis conducted on geographies consisting of 117,345,234 people shows a strong positive correlation between the proportion of Potawatomi and unemploymnet rate among females in the United States with a correlation coefficient (R) of 0.726 and weighted average of 5.2%, a difference of 17.0%.
Female Unemployment Correlation Summary
| Measurement | Swedish | Potawatomi |
| Minimum | 0.50% | 2.0% |
| Maximum | 87.9% | 41.7% |
| Range | 87.4% | 39.7% |
| Mean | 11.3% | 7.5% |
| Median | 4.2% | 5.5% |
| Interquartile 25% (IQ1) | 3.7% | 4.1% |
| Interquartile 75% (IQ3) | 6.5% | 7.6% |
| Interquartile Range (IQR) | 2.8% | 3.5% |
| Standard Deviation (Sample) | 18.9% | 7.3% |
| Standard Deviation (Population) | 18.8% | 7.2% |
Similar Demographics by Female Unemployment
Demographics Similar to Swedes by Female Unemployment
In terms of female unemployment, the demographic groups most similar to Swedes are Chinese (4.5%, a difference of 0.77%), German (4.5%, a difference of 0.79%), Slovene (4.5%, a difference of 1.1%), Hmong (4.4%, a difference of 1.2%), and Danish (4.4%, a difference of 1.3%).
| Demographics | Rating | Rank | Female Unemployment |
| Norwegians | 100.0 /100 | #1 | Exceptional 4.2% |
| Czechs | 100.0 /100 | #2 | Exceptional 4.4% |
| Luxembourgers | 100.0 /100 | #3 | Exceptional 4.4% |
| Danes | 100.0 /100 | #4 | Exceptional 4.4% |
| Hmong | 100.0 /100 | #5 | Exceptional 4.4% |
| Swedes | 100.0 /100 | #6 | Exceptional 4.4% |
| Chinese | 100.0 /100 | #7 | Exceptional 4.5% |
| Germans | 100.0 /100 | #8 | Exceptional 4.5% |
| Slovenes | 100.0 /100 | #9 | Exceptional 4.5% |
| Swiss | 100.0 /100 | #10 | Exceptional 4.6% |
| Scandinavians | 100.0 /100 | #11 | Exceptional 4.6% |
| Dutch | 100.0 /100 | #12 | Exceptional 4.6% |
| Belgians | 100.0 /100 | #13 | Exceptional 4.6% |
| Finns | 100.0 /100 | #14 | Exceptional 4.6% |
| English | 100.0 /100 | #15 | Exceptional 4.6% |
Demographics Similar to Potawatomi by Female Unemployment
In terms of female unemployment, the demographic groups most similar to Potawatomi are Immigrants from Pakistan (5.2%, a difference of 0.050%), Immigrants from Spain (5.2%, a difference of 0.060%), Immigrants from Micronesia (5.2%, a difference of 0.070%), Immigrants from Asia (5.2%, a difference of 0.11%), and Bangladeshi (5.2%, a difference of 0.11%).
| Demographics | Rating | Rank | Female Unemployment |
| Immigrants | Egypt | 70.0 /100 | #155 | Good 5.2% |
| Immigrants | Northern Africa | 69.6 /100 | #156 | Good 5.2% |
| Immigrants | Russia | 69.3 /100 | #157 | Good 5.2% |
| Albanians | 68.3 /100 | #158 | Good 5.2% |
| Immigrants | Micronesia | 66.9 /100 | #159 | Good 5.2% |
| Immigrants | Spain | 66.8 /100 | #160 | Good 5.2% |
| Immigrants | Pakistan | 66.7 /100 | #161 | Good 5.2% |
| Potawatomi | 65.9 /100 | #162 | Good 5.2% |
| Immigrants | Asia | 64.3 /100 | #163 | Good 5.2% |
| Bangladeshis | 64.3 /100 | #164 | Good 5.2% |
| Syrians | 62.8 /100 | #165 | Good 5.2% |
| Native Hawaiians | 62.7 /100 | #166 | Good 5.2% |
| Immigrants | Thailand | 62.1 /100 | #167 | Good 5.2% |
| Sri Lankans | 59.4 /100 | #168 | Average 5.2% |
| Immigrants | Chile | 59.0 /100 | #169 | Average 5.2% |