Immigrants from Denmark vs Immigrants from Eastern Asia Median Household Income
COMPARE
Immigrants from Denmark
Immigrants from Eastern Asia
Median Household Income
Median Household Income Comparison
Immigrants from Denmark
Immigrants from Eastern Asia
$98,510
MEDIAN HOUSEHOLD INCOME
100.0/ 100
METRIC RATING
32nd/ 347
METRIC RANK
$104,796
MEDIAN HOUSEHOLD INCOME
100.0/ 100
METRIC RATING
13th/ 347
METRIC RANK
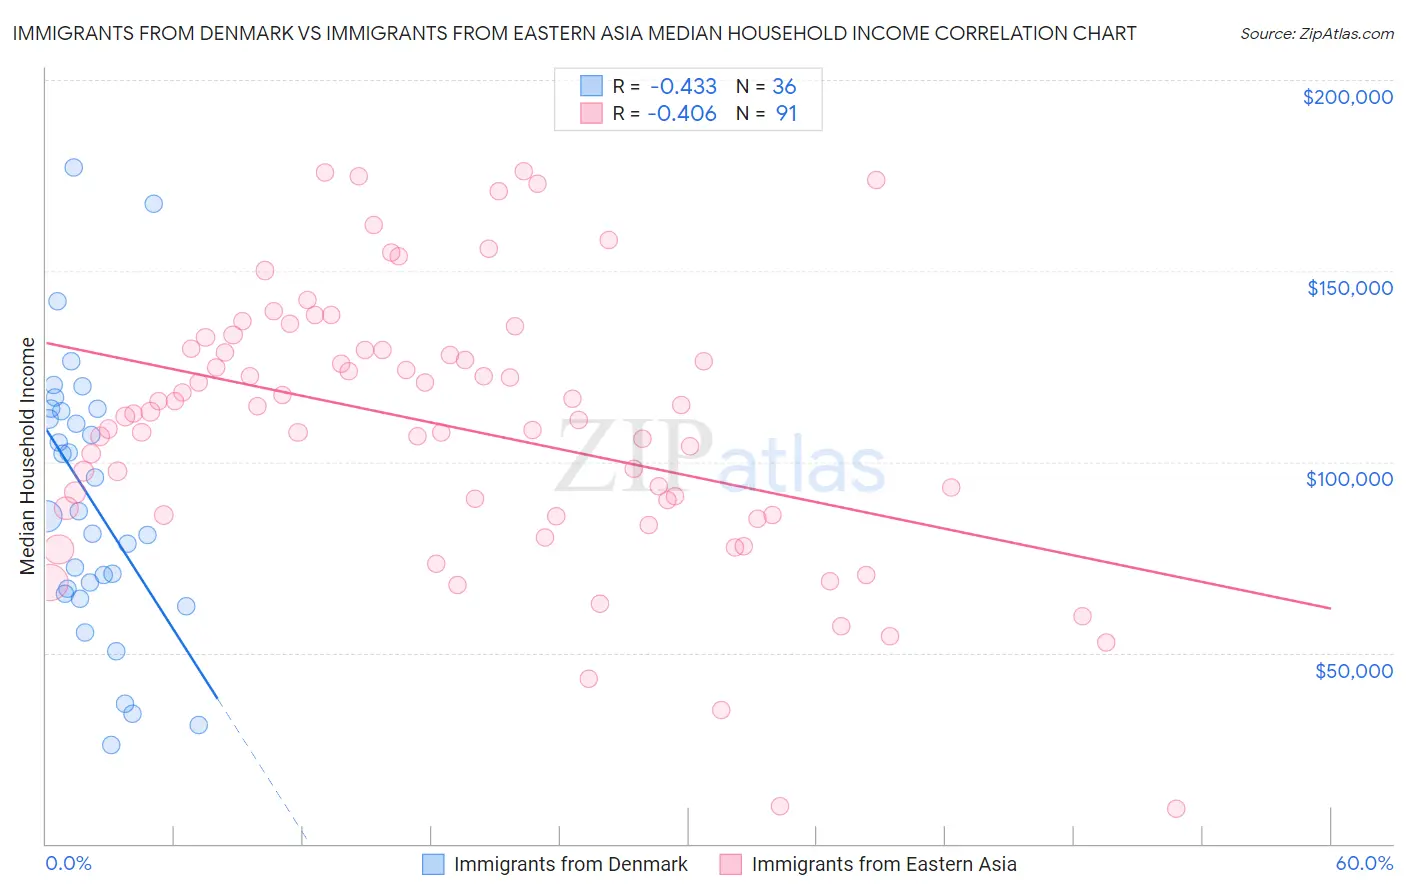
Immigrants from Denmark vs Immigrants from Eastern Asia Median Household Income Correlation Chart
The statistical analysis conducted on geographies consisting of 136,400,553 people shows a moderate negative correlation between the proportion of Immigrants from Denmark and median household income in the United States with a correlation coefficient (R) of -0.433 and weighted average of $98,510. Similarly, the statistical analysis conducted on geographies consisting of 499,224,968 people shows a moderate negative correlation between the proportion of Immigrants from Eastern Asia and median household income in the United States with a correlation coefficient (R) of -0.406 and weighted average of $104,796, a difference of 6.4%.
Median Household Income Correlation Summary
| Measurement | Immigrants from Denmark | Immigrants from Eastern Asia |
| Minimum | $26,000 | $9,145 |
| Maximum | $177,030 | $175,983 |
| Range | $151,030 | $166,838 |
| Mean | $89,771 | $109,310 |
| Median | $86,345 | $112,551 |
| Interquartile 25% (IQ1) | $66,126 | $86,179 |
| Interquartile 75% (IQ3) | $113,584 | $129,240 |
| Interquartile Range (IQR) | $47,458 | $43,061 |
| Standard Deviation (Sample) | $35,565 | $35,066 |
| Standard Deviation (Population) | $35,068 | $34,873 |
Demographics Similar to Immigrants from Denmark and Immigrants from Eastern Asia by Median Household Income
In terms of median household income, the demographic groups most similar to Immigrants from Denmark are Turkish ($99,389, a difference of 0.89%), Immigrants from Northern Europe ($99,813, a difference of 1.3%), Immigrants from Asia ($99,933, a difference of 1.4%), Immigrants from Sri Lanka ($99,943, a difference of 1.5%), and Bhutanese ($100,151, a difference of 1.7%). Similarly, the demographic groups most similar to Immigrants from Eastern Asia are Immigrants from Ireland ($104,692, a difference of 0.10%), Indian (Asian) ($105,262, a difference of 0.45%), Immigrants from Israel ($104,090, a difference of 0.68%), Burmese ($103,145, a difference of 1.6%), and Immigrants from Korea ($102,962, a difference of 1.8%).
| Demographics | Rating | Rank | Median Household Income |
| Indians (Asian) | 100.0 /100 | #12 | Exceptional $105,262 |
| Immigrants | Eastern Asia | 100.0 /100 | #13 | Exceptional $104,796 |
| Immigrants | Ireland | 100.0 /100 | #14 | Exceptional $104,692 |
| Immigrants | Israel | 100.0 /100 | #15 | Exceptional $104,090 |
| Burmese | 100.0 /100 | #16 | Exceptional $103,145 |
| Immigrants | Korea | 100.0 /100 | #17 | Exceptional $102,962 |
| Cypriots | 100.0 /100 | #18 | Exceptional $102,843 |
| Immigrants | Australia | 100.0 /100 | #19 | Exceptional $102,562 |
| Bolivians | 100.0 /100 | #20 | Exceptional $102,195 |
| Eastern Europeans | 100.0 /100 | #21 | Exceptional $101,781 |
| Asians | 100.0 /100 | #22 | Exceptional $101,681 |
| Immigrants | Bolivia | 100.0 /100 | #23 | Exceptional $101,394 |
| Immigrants | Japan | 100.0 /100 | #24 | Exceptional $100,711 |
| Immigrants | Sweden | 100.0 /100 | #25 | Exceptional $100,699 |
| Immigrants | Belgium | 100.0 /100 | #26 | Exceptional $100,306 |
| Bhutanese | 100.0 /100 | #27 | Exceptional $100,151 |
| Immigrants | Sri Lanka | 100.0 /100 | #28 | Exceptional $99,943 |
| Immigrants | Asia | 100.0 /100 | #29 | Exceptional $99,933 |
| Immigrants | Northern Europe | 100.0 /100 | #30 | Exceptional $99,813 |
| Turks | 100.0 /100 | #31 | Exceptional $99,389 |
| Immigrants | Denmark | 100.0 /100 | #32 | Exceptional $98,510 |