Immigrants from Czechoslovakia vs Crow Unemployment Among Women with Children Ages 6 to 17 years
COMPARE
Immigrants from Czechoslovakia
Crow
Unemployment Among Women with Children Ages 6 to 17 years
Unemployment Among Women with Children Ages 6 to 17 years Comparison
Immigrants from Czechoslovakia
Crow
9.0%
UNEMPLOYMENT AMONG WOMEN WITH CHILDREN AGES 6 TO 17 YEARS
34.5/ 100
METRIC RATING
181st/ 347
METRIC RANK
9.2%
UNEMPLOYMENT AMONG WOMEN WITH CHILDREN AGES 6 TO 17 YEARS
5.8/ 100
METRIC RATING
221st/ 347
METRIC RANK
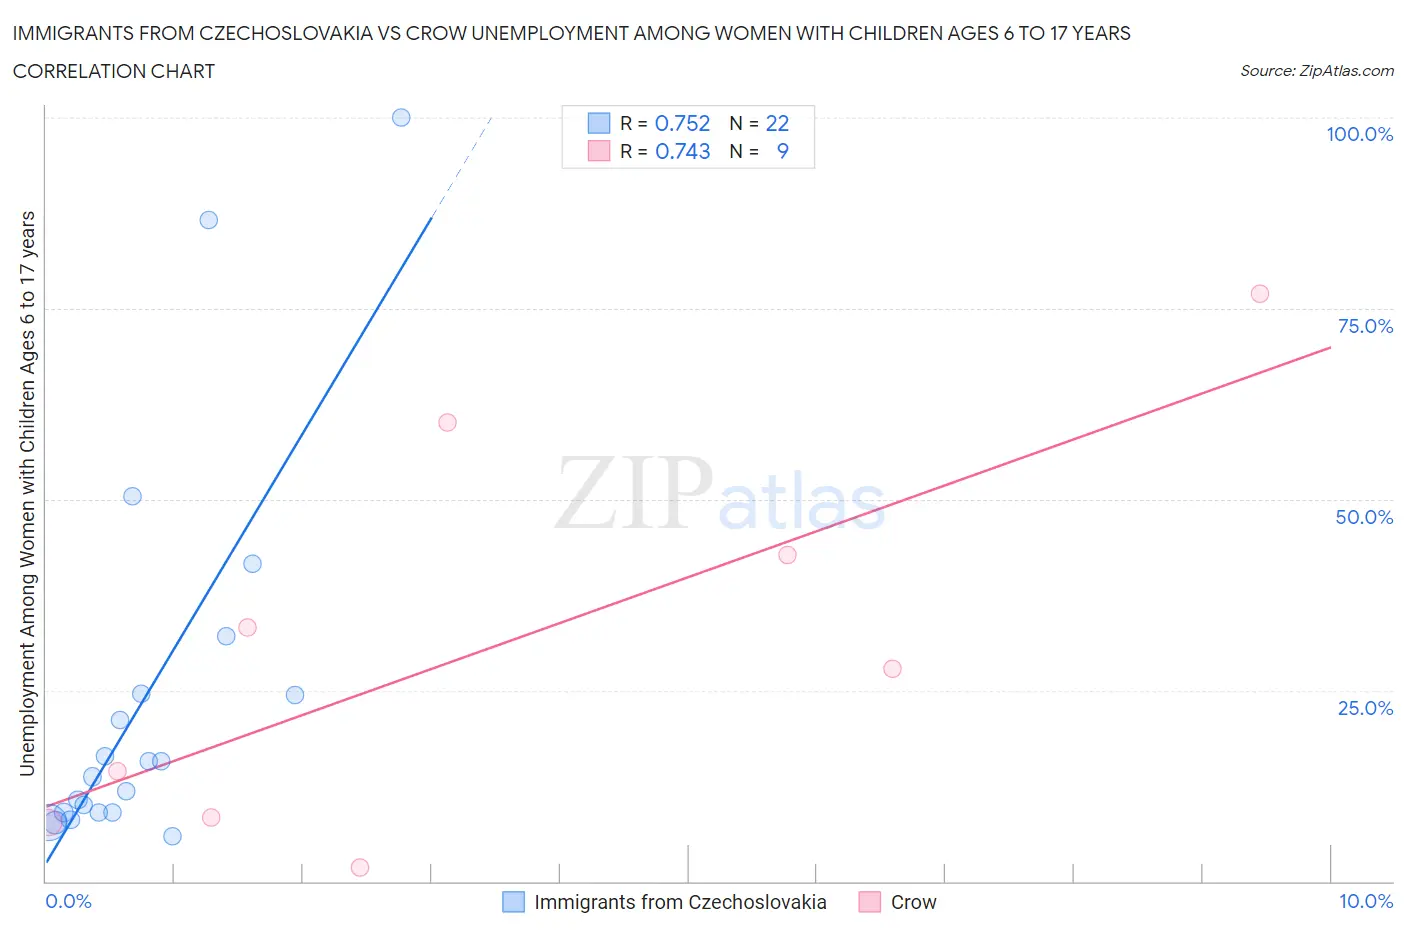
Immigrants from Czechoslovakia vs Crow Unemployment Among Women with Children Ages 6 to 17 years Correlation Chart
The statistical analysis conducted on geographies consisting of 154,961,774 people shows a strong positive correlation between the proportion of Immigrants from Czechoslovakia and unemployment rate among women with children between the ages 6 and 17 in the United States with a correlation coefficient (R) of 0.752 and weighted average of 9.0%. Similarly, the statistical analysis conducted on geographies consisting of 53,126,495 people shows a strong positive correlation between the proportion of Crow and unemployment rate among women with children between the ages 6 and 17 in the United States with a correlation coefficient (R) of 0.743 and weighted average of 9.2%, a difference of 2.4%.
Unemployment Among Women with Children Ages 6 to 17 years Correlation Summary
| Measurement | Immigrants from Czechoslovakia | Crow |
| Minimum | 5.9% | 1.8% |
| Maximum | 100.0% | 76.9% |
| Range | 94.1% | 75.1% |
| Mean | 24.1% | 30.3% |
| Median | 14.7% | 27.8% |
| Interquartile 25% (IQ1) | 9.0% | 8.0% |
| Interquartile 75% (IQ3) | 24.6% | 51.4% |
| Interquartile Range (IQR) | 15.6% | 43.4% |
| Standard Deviation (Sample) | 25.3% | 25.7% |
| Standard Deviation (Population) | 24.7% | 24.2% |
Similar Demographics by Unemployment Among Women with Children Ages 6 to 17 years
Demographics Similar to Immigrants from Czechoslovakia by Unemployment Among Women with Children Ages 6 to 17 years
In terms of unemployment among women with children ages 6 to 17 years, the demographic groups most similar to Immigrants from Czechoslovakia are South American Indian (9.0%, a difference of 0.010%), Swiss (9.0%, a difference of 0.050%), Palestinian (9.0%, a difference of 0.050%), Immigrants from Congo (9.0%, a difference of 0.10%), and Immigrants from Spain (9.0%, a difference of 0.10%).
| Demographics | Rating | Rank | Unemployment Among Women with Children Ages 6 to 17 years |
| Immigrants | Costa Rica | 50.0 /100 | #174 | Average 9.0% |
| Immigrants | Sierra Leone | 45.9 /100 | #175 | Average 9.0% |
| Immigrants | Italy | 43.7 /100 | #176 | Average 9.0% |
| Immigrants | Jordan | 41.6 /100 | #177 | Average 9.0% |
| Menominee | 39.3 /100 | #178 | Fair 9.0% |
| Immigrants | Zaire | 38.3 /100 | #179 | Fair 9.0% |
| Ethiopians | 37.6 /100 | #180 | Fair 9.0% |
| Immigrants | Czechoslovakia | 34.5 /100 | #181 | Fair 9.0% |
| South American Indians | 34.4 /100 | #182 | Fair 9.0% |
| Swiss | 33.5 /100 | #183 | Fair 9.0% |
| Palestinians | 33.4 /100 | #184 | Fair 9.0% |
| Immigrants | Congo | 32.5 /100 | #185 | Fair 9.0% |
| Immigrants | Spain | 32.4 /100 | #186 | Fair 9.0% |
| Comanche | 30.0 /100 | #187 | Fair 9.0% |
| Immigrants | Syria | 29.7 /100 | #188 | Fair 9.1% |
Demographics Similar to Crow by Unemployment Among Women with Children Ages 6 to 17 years
In terms of unemployment among women with children ages 6 to 17 years, the demographic groups most similar to Crow are Immigrants from Southern Europe (9.2%, a difference of 0.010%), Immigrants from Eritrea (9.2%, a difference of 0.010%), Belgian (9.2%, a difference of 0.11%), Immigrants from El Salvador (9.3%, a difference of 0.12%), and Chinese (9.3%, a difference of 0.13%).
| Demographics | Rating | Rank | Unemployment Among Women with Children Ages 6 to 17 years |
| Iroquois | 7.5 /100 | #214 | Tragic 9.2% |
| Immigrants | Germany | 7.2 /100 | #215 | Tragic 9.2% |
| Immigrants | Uruguay | 7.2 /100 | #216 | Tragic 9.2% |
| Germans | 7.2 /100 | #217 | Tragic 9.2% |
| Syrians | 6.9 /100 | #218 | Tragic 9.2% |
| Immigrants | Scotland | 6.6 /100 | #219 | Tragic 9.2% |
| Belgians | 6.4 /100 | #220 | Tragic 9.2% |
| Crow | 5.8 /100 | #221 | Tragic 9.2% |
| Immigrants | Southern Europe | 5.8 /100 | #222 | Tragic 9.2% |
| Immigrants | Eritrea | 5.8 /100 | #223 | Tragic 9.2% |
| Immigrants | El Salvador | 5.3 /100 | #224 | Tragic 9.3% |
| Chinese | 5.2 /100 | #225 | Tragic 9.3% |
| Immigrants | Azores | 4.6 /100 | #226 | Tragic 9.3% |
| Panamanians | 4.5 /100 | #227 | Tragic 9.3% |
| Estonians | 4.4 /100 | #228 | Tragic 9.3% |