Aleut vs Immigrants from Kazakhstan Unemployment Among Women with Children Ages 6 to 17 years
COMPARE
Aleut
Immigrants from Kazakhstan
Unemployment Among Women with Children Ages 6 to 17 years
Unemployment Among Women with Children Ages 6 to 17 years Comparison
Aleuts
Immigrants from Kazakhstan
9.6%
UNEMPLOYMENT AMONG WOMEN WITH CHILDREN AGES 6 TO 17 YEARS
0.1/ 100
METRIC RATING
274th/ 347
METRIC RANK
9.1%
UNEMPLOYMENT AMONG WOMEN WITH CHILDREN AGES 6 TO 17 YEARS
25.3/ 100
METRIC RATING
194th/ 347
METRIC RANK
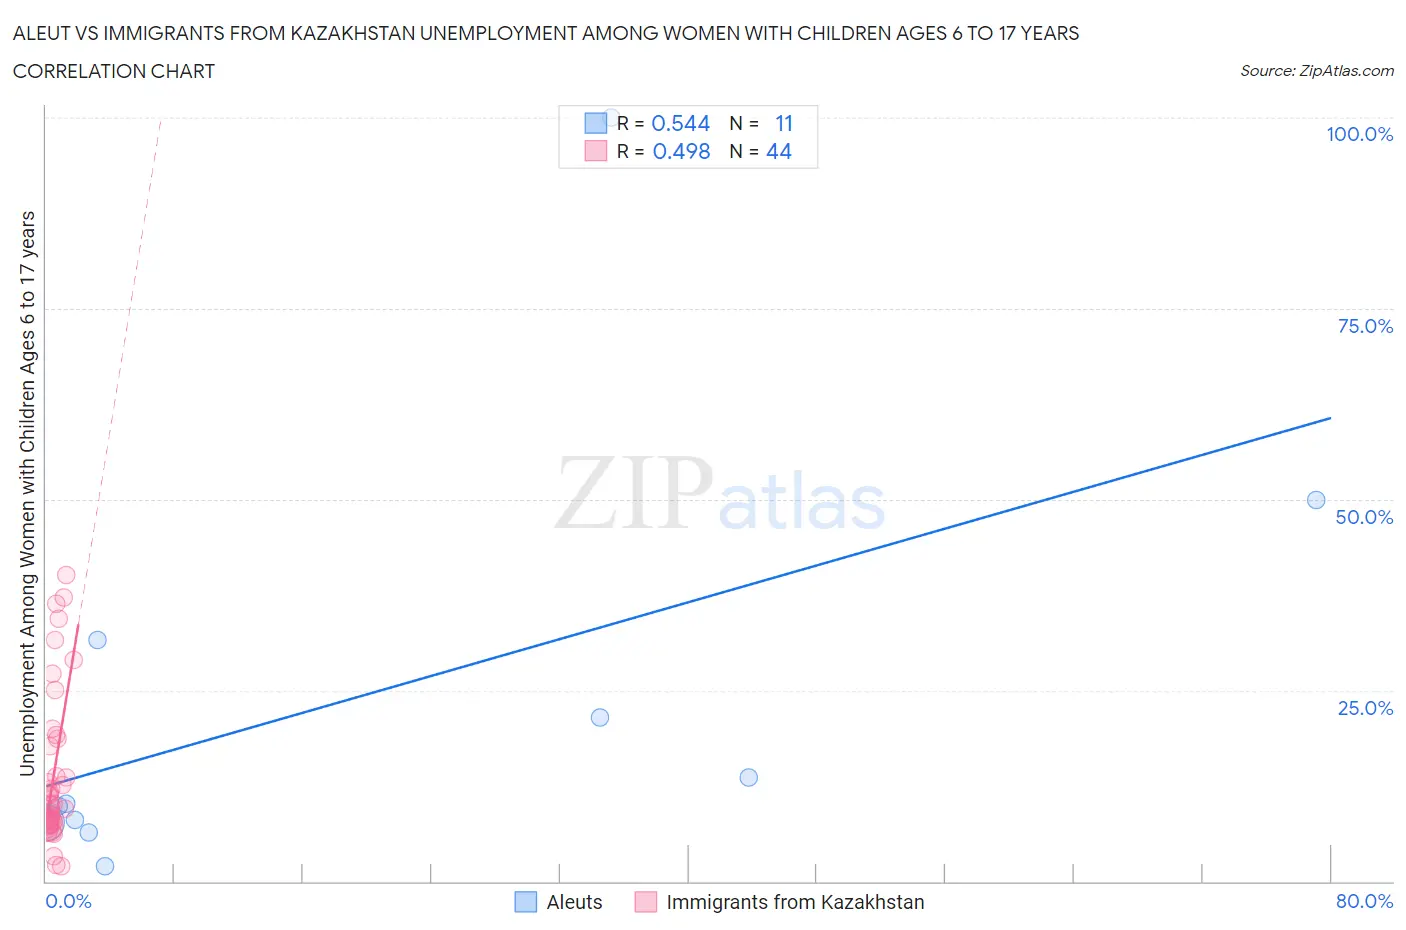
Aleut vs Immigrants from Kazakhstan Unemployment Among Women with Children Ages 6 to 17 years Correlation Chart
The statistical analysis conducted on geographies consisting of 54,998,269 people shows a substantial positive correlation between the proportion of Aleuts and unemployment rate among women with children between the ages 6 and 17 in the United States with a correlation coefficient (R) of 0.544 and weighted average of 9.6%. Similarly, the statistical analysis conducted on geographies consisting of 103,492,254 people shows a moderate positive correlation between the proportion of Immigrants from Kazakhstan and unemployment rate among women with children between the ages 6 and 17 in the United States with a correlation coefficient (R) of 0.498 and weighted average of 9.1%, a difference of 6.3%.
Unemployment Among Women with Children Ages 6 to 17 years Correlation Summary
| Measurement | Aleut | Immigrants from Kazakhstan |
| Minimum | 1.9% | 1.9% |
| Maximum | 100.0% | 40.1% |
| Range | 98.1% | 38.2% |
| Mean | 23.7% | 13.9% |
| Median | 10.1% | 10.0% |
| Interquartile 25% (IQ1) | 7.7% | 7.6% |
| Interquartile 75% (IQ3) | 31.6% | 18.1% |
| Interquartile Range (IQR) | 23.9% | 10.5% |
| Standard Deviation (Sample) | 28.9% | 10.0% |
| Standard Deviation (Population) | 27.5% | 9.8% |
Similar Demographics by Unemployment Among Women with Children Ages 6 to 17 years
Demographics Similar to Aleuts by Unemployment Among Women with Children Ages 6 to 17 years
In terms of unemployment among women with children ages 6 to 17 years, the demographic groups most similar to Aleuts are White/Caucasian (9.6%, a difference of 0.050%), Kiowa (9.6%, a difference of 0.060%), Immigrants from Latin America (9.6%, a difference of 0.12%), U.S. Virgin Islander (9.7%, a difference of 0.44%), and Immigrants from Portugal (9.7%, a difference of 0.44%).
| Demographics | Rating | Rank | Unemployment Among Women with Children Ages 6 to 17 years |
| Irish | 0.3 /100 | #267 | Tragic 9.5% |
| Ghanaians | 0.2 /100 | #268 | Tragic 9.6% |
| Blackfeet | 0.2 /100 | #269 | Tragic 9.6% |
| Immigrants | Nicaragua | 0.2 /100 | #270 | Tragic 9.6% |
| Immigrants | Latin America | 0.1 /100 | #271 | Tragic 9.6% |
| Kiowa | 0.1 /100 | #272 | Tragic 9.6% |
| Whites/Caucasians | 0.1 /100 | #273 | Tragic 9.6% |
| Aleuts | 0.1 /100 | #274 | Tragic 9.6% |
| U.S. Virgin Islanders | 0.1 /100 | #275 | Tragic 9.7% |
| Immigrants | Portugal | 0.1 /100 | #276 | Tragic 9.7% |
| British West Indians | 0.1 /100 | #277 | Tragic 9.7% |
| French | 0.1 /100 | #278 | Tragic 9.7% |
| Scotch-Irish | 0.1 /100 | #279 | Tragic 9.7% |
| Seminole | 0.1 /100 | #280 | Tragic 9.7% |
| Jamaicans | 0.0 /100 | #281 | Tragic 9.8% |
Demographics Similar to Immigrants from Kazakhstan by Unemployment Among Women with Children Ages 6 to 17 years
In terms of unemployment among women with children ages 6 to 17 years, the demographic groups most similar to Immigrants from Kazakhstan are Austrian (9.1%, a difference of 0.020%), Immigrants from Turkey (9.1%, a difference of 0.030%), Brazilian (9.1%, a difference of 0.050%), Immigrants from Panama (9.1%, a difference of 0.060%), and Guamanian/Chamorro (9.1%, a difference of 0.11%).
| Demographics | Rating | Rank | Unemployment Among Women with Children Ages 6 to 17 years |
| Comanche | 30.0 /100 | #187 | Fair 9.0% |
| Immigrants | Syria | 29.7 /100 | #188 | Fair 9.1% |
| Immigrants | Immigrants | 29.2 /100 | #189 | Fair 9.1% |
| Slovenes | 28.5 /100 | #190 | Fair 9.1% |
| Belizeans | 28.4 /100 | #191 | Fair 9.1% |
| Guamanians/Chamorros | 27.2 /100 | #192 | Fair 9.1% |
| Immigrants | Turkey | 25.8 /100 | #193 | Fair 9.1% |
| Immigrants | Kazakhstan | 25.3 /100 | #194 | Fair 9.1% |
| Austrians | 25.0 /100 | #195 | Fair 9.1% |
| Brazilians | 24.4 /100 | #196 | Fair 9.1% |
| Immigrants | Panama | 24.3 /100 | #197 | Fair 9.1% |
| Guyanese | 21.8 /100 | #198 | Fair 9.1% |
| Czechoslovakians | 20.8 /100 | #199 | Fair 9.1% |
| Trinidadians and Tobagonians | 18.2 /100 | #200 | Poor 9.1% |
| Immigrants | Trinidad and Tobago | 16.7 /100 | #201 | Poor 9.1% |