Immigrants from Czechoslovakia vs Samoan Unemployment Among Women with Children Ages 6 to 17 years
COMPARE
Immigrants from Czechoslovakia
Samoan
Unemployment Among Women with Children Ages 6 to 17 years
Unemployment Among Women with Children Ages 6 to 17 years Comparison
Immigrants from Czechoslovakia
Samoans
9.0%
UNEMPLOYMENT AMONG WOMEN WITH CHILDREN AGES 6 TO 17 YEARS
34.5/ 100
METRIC RATING
181st/ 347
METRIC RANK
8.4%
UNEMPLOYMENT AMONG WOMEN WITH CHILDREN AGES 6 TO 17 YEARS
99.7/ 100
METRIC RATING
74th/ 347
METRIC RANK
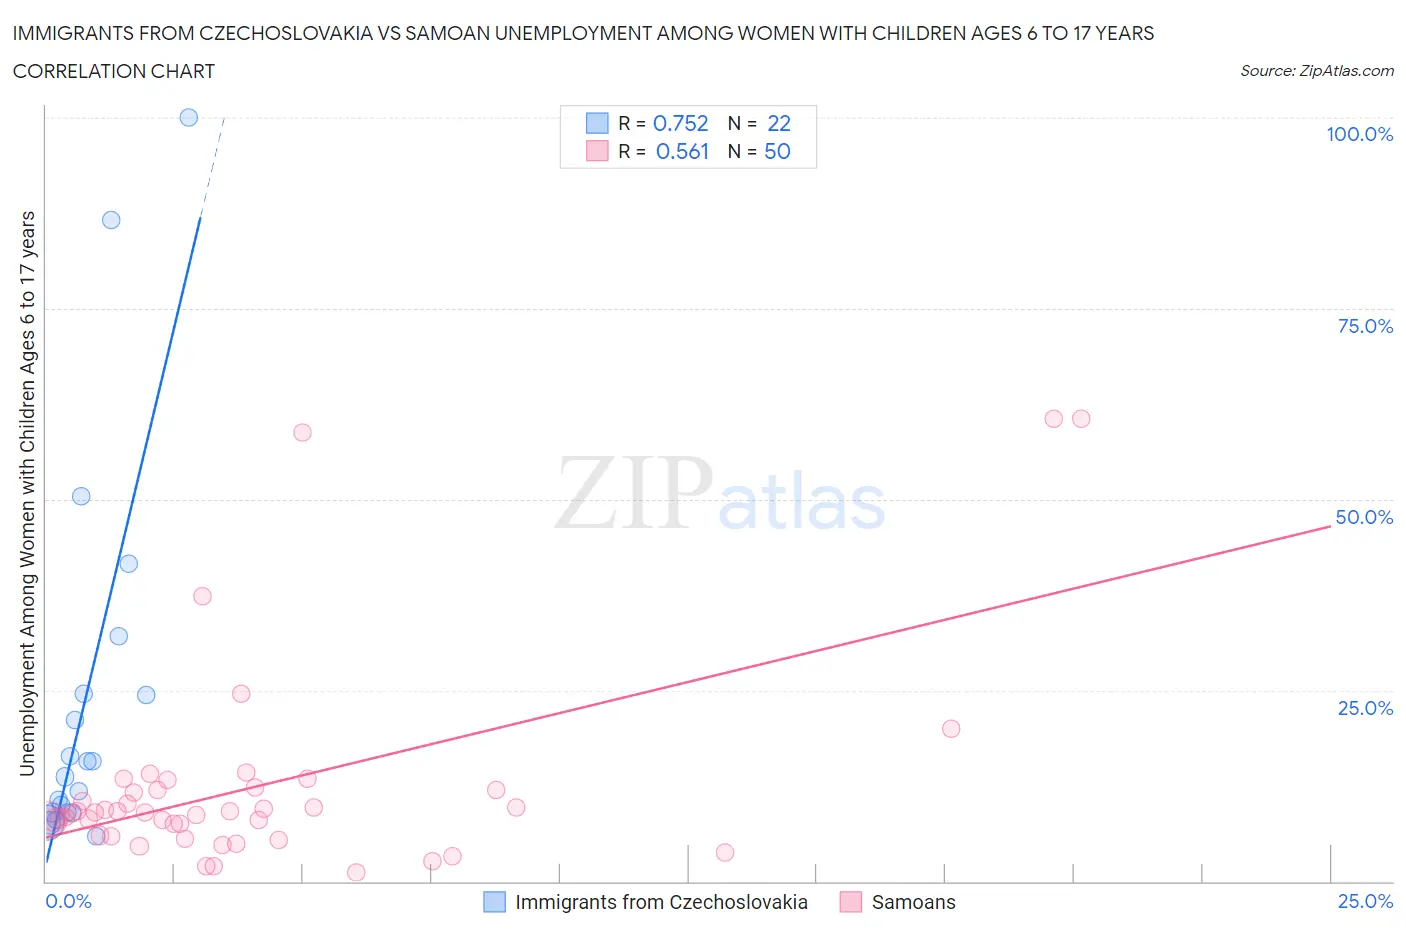
Immigrants from Czechoslovakia vs Samoan Unemployment Among Women with Children Ages 6 to 17 years Correlation Chart
The statistical analysis conducted on geographies consisting of 154,961,774 people shows a strong positive correlation between the proportion of Immigrants from Czechoslovakia and unemployment rate among women with children between the ages 6 and 17 in the United States with a correlation coefficient (R) of 0.752 and weighted average of 9.0%. Similarly, the statistical analysis conducted on geographies consisting of 183,981,110 people shows a substantial positive correlation between the proportion of Samoans and unemployment rate among women with children between the ages 6 and 17 in the United States with a correlation coefficient (R) of 0.561 and weighted average of 8.4%, a difference of 7.7%.
Unemployment Among Women with Children Ages 6 to 17 years Correlation Summary
| Measurement | Immigrants from Czechoslovakia | Samoan |
| Minimum | 5.9% | 1.2% |
| Maximum | 100.0% | 60.6% |
| Range | 94.1% | 59.4% |
| Mean | 24.1% | 12.5% |
| Median | 14.7% | 9.0% |
| Interquartile 25% (IQ1) | 9.0% | 6.0% |
| Interquartile 75% (IQ3) | 24.6% | 12.0% |
| Interquartile Range (IQR) | 15.6% | 6.0% |
| Standard Deviation (Sample) | 25.3% | 13.5% |
| Standard Deviation (Population) | 24.7% | 13.3% |
Similar Demographics by Unemployment Among Women with Children Ages 6 to 17 years
Demographics Similar to Immigrants from Czechoslovakia by Unemployment Among Women with Children Ages 6 to 17 years
In terms of unemployment among women with children ages 6 to 17 years, the demographic groups most similar to Immigrants from Czechoslovakia are South American Indian (9.0%, a difference of 0.010%), Swiss (9.0%, a difference of 0.050%), Palestinian (9.0%, a difference of 0.050%), Immigrants from Congo (9.0%, a difference of 0.10%), and Immigrants from Spain (9.0%, a difference of 0.10%).
| Demographics | Rating | Rank | Unemployment Among Women with Children Ages 6 to 17 years |
| Immigrants | Costa Rica | 50.0 /100 | #174 | Average 9.0% |
| Immigrants | Sierra Leone | 45.9 /100 | #175 | Average 9.0% |
| Immigrants | Italy | 43.7 /100 | #176 | Average 9.0% |
| Immigrants | Jordan | 41.6 /100 | #177 | Average 9.0% |
| Menominee | 39.3 /100 | #178 | Fair 9.0% |
| Immigrants | Zaire | 38.3 /100 | #179 | Fair 9.0% |
| Ethiopians | 37.6 /100 | #180 | Fair 9.0% |
| Immigrants | Czechoslovakia | 34.5 /100 | #181 | Fair 9.0% |
| South American Indians | 34.4 /100 | #182 | Fair 9.0% |
| Swiss | 33.5 /100 | #183 | Fair 9.0% |
| Palestinians | 33.4 /100 | #184 | Fair 9.0% |
| Immigrants | Congo | 32.5 /100 | #185 | Fair 9.0% |
| Immigrants | Spain | 32.4 /100 | #186 | Fair 9.0% |
| Comanche | 30.0 /100 | #187 | Fair 9.0% |
| Immigrants | Syria | 29.7 /100 | #188 | Fair 9.1% |
Demographics Similar to Samoans by Unemployment Among Women with Children Ages 6 to 17 years
In terms of unemployment among women with children ages 6 to 17 years, the demographic groups most similar to Samoans are Immigrants from Sri Lanka (8.4%, a difference of 0.080%), Immigrants from Moldova (8.4%, a difference of 0.11%), Iraqi (8.4%, a difference of 0.16%), Pakistani (8.4%, a difference of 0.29%), and Mongolian (8.4%, a difference of 0.30%).
| Demographics | Rating | Rank | Unemployment Among Women with Children Ages 6 to 17 years |
| Armenians | 99.9 /100 | #67 | Exceptional 8.3% |
| Marshallese | 99.9 /100 | #68 | Exceptional 8.3% |
| Immigrants | Thailand | 99.9 /100 | #69 | Exceptional 8.3% |
| Norwegians | 99.9 /100 | #70 | Exceptional 8.3% |
| Immigrants | Australia | 99.8 /100 | #71 | Exceptional 8.3% |
| Immigrants | Nepal | 99.8 /100 | #72 | Exceptional 8.3% |
| Spanish Americans | 99.8 /100 | #73 | Exceptional 8.4% |
| Samoans | 99.7 /100 | #74 | Exceptional 8.4% |
| Immigrants | Sri Lanka | 99.7 /100 | #75 | Exceptional 8.4% |
| Immigrants | Moldova | 99.7 /100 | #76 | Exceptional 8.4% |
| Iraqis | 99.7 /100 | #77 | Exceptional 8.4% |
| Pakistanis | 99.6 /100 | #78 | Exceptional 8.4% |
| Mongolians | 99.6 /100 | #79 | Exceptional 8.4% |
| Immigrants | Belarus | 99.6 /100 | #80 | Exceptional 8.4% |
| Immigrants | Bolivia | 99.6 /100 | #81 | Exceptional 8.4% |