Immigrants from Lebanon vs Austrian Unemployment
COMPARE
Immigrants from Lebanon
Austrian
Unemployment
Unemployment Comparison
Immigrants from Lebanon
Austrians
5.5%
UNEMPLOYMENT
7.0/ 100
METRIC RATING
227th/ 347
METRIC RANK
4.8%
UNEMPLOYMENT
99.5/ 100
METRIC RATING
44th/ 347
METRIC RANK
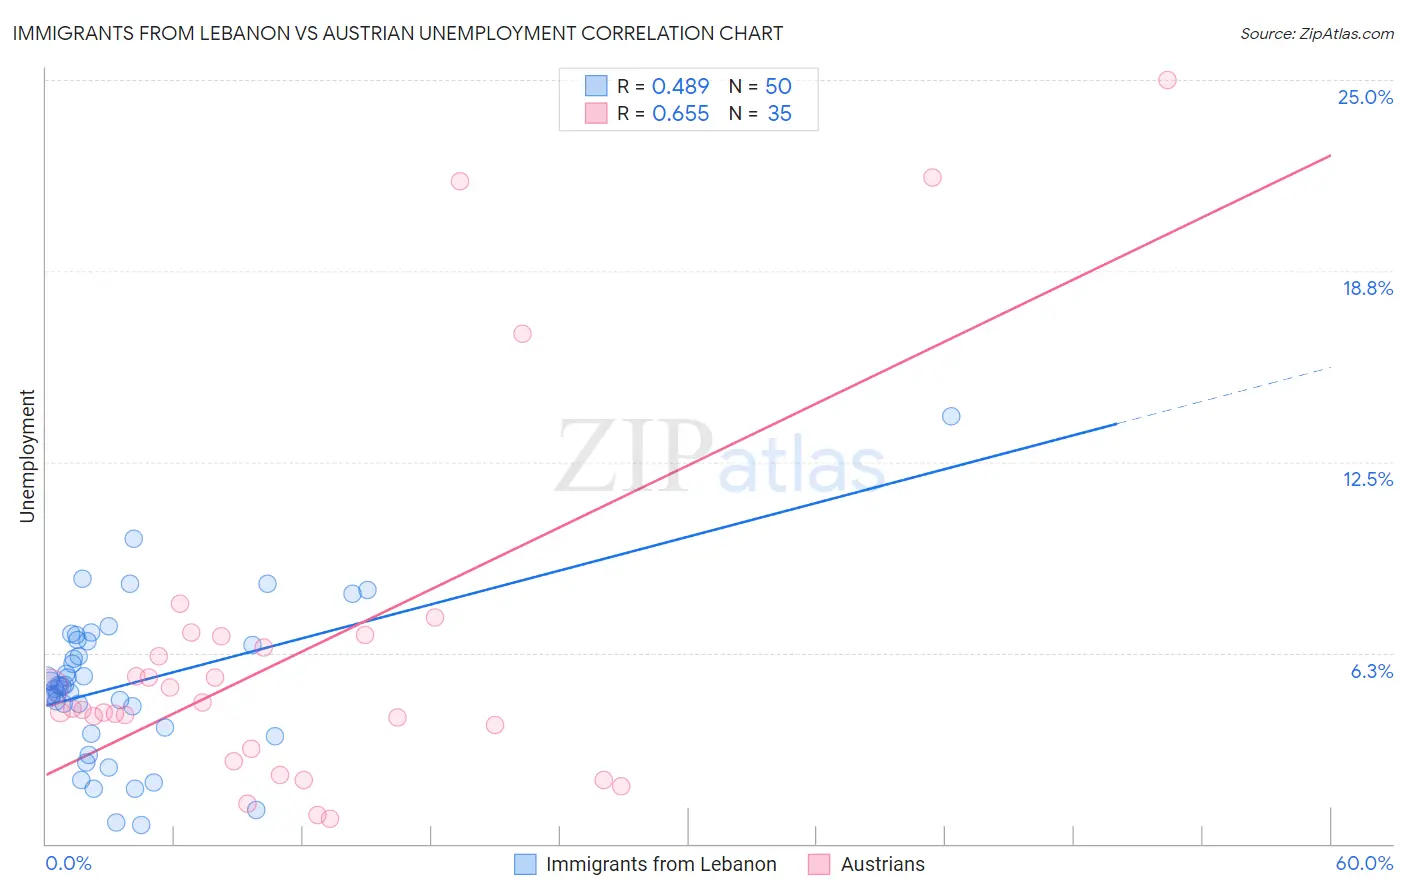
Immigrants from Lebanon vs Austrian Unemployment Correlation Chart
The statistical analysis conducted on geographies consisting of 217,130,454 people shows a moderate positive correlation between the proportion of Immigrants from Lebanon and unemployment in the United States with a correlation coefficient (R) of 0.489 and weighted average of 5.5%. Similarly, the statistical analysis conducted on geographies consisting of 451,169,494 people shows a significant positive correlation between the proportion of Austrians and unemployment in the United States with a correlation coefficient (R) of 0.655 and weighted average of 4.8%, a difference of 13.1%.
Unemployment Correlation Summary
| Measurement | Immigrants from Lebanon | Austrian |
| Minimum | 0.60% | 0.80% |
| Maximum | 14.0% | 25.0% |
| Range | 13.4% | 24.2% |
| Mean | 5.2% | 6.3% |
| Median | 5.2% | 4.4% |
| Interquartile 25% (IQ1) | 3.8% | 3.1% |
| Interquartile 75% (IQ3) | 6.6% | 6.8% |
| Interquartile Range (IQR) | 2.8% | 3.7% |
| Standard Deviation (Sample) | 2.5% | 5.9% |
| Standard Deviation (Population) | 2.5% | 5.8% |
Similar Demographics by Unemployment
Demographics Similar to Immigrants from Lebanon by Unemployment
In terms of unemployment, the demographic groups most similar to Immigrants from Lebanon are Samoan (5.5%, a difference of 0.030%), Guamanian/Chamorro (5.5%, a difference of 0.15%), South American Indian (5.5%, a difference of 0.18%), Israeli (5.4%, a difference of 0.38%), and Hawaiian (5.5%, a difference of 0.41%).
| Demographics | Rating | Rank | Unemployment |
| Soviet Union | 10.6 /100 | #220 | Poor 5.4% |
| Immigrants | Philippines | 10.4 /100 | #221 | Poor 5.4% |
| Iroquois | 10.3 /100 | #222 | Poor 5.4% |
| Seminole | 9.2 /100 | #223 | Tragic 5.4% |
| Israelis | 8.8 /100 | #224 | Tragic 5.4% |
| South American Indians | 7.8 /100 | #225 | Tragic 5.5% |
| Samoans | 7.1 /100 | #226 | Tragic 5.5% |
| Immigrants | Lebanon | 7.0 /100 | #227 | Tragic 5.5% |
| Guamanians/Chamorros | 6.3 /100 | #228 | Tragic 5.5% |
| Hawaiians | 5.4 /100 | #229 | Tragic 5.5% |
| Ottawa | 5.4 /100 | #230 | Tragic 5.5% |
| Immigrants | Africa | 4.9 /100 | #231 | Tragic 5.5% |
| Comanche | 4.9 /100 | #232 | Tragic 5.5% |
| Immigrants | Syria | 4.8 /100 | #233 | Tragic 5.5% |
| Panamanians | 4.7 /100 | #234 | Tragic 5.5% |
Demographics Similar to Austrians by Unemployment
In terms of unemployment, the demographic groups most similar to Austrians are French (4.8%, a difference of 0.050%), Yugoslavian (4.8%, a difference of 0.060%), Immigrants from Nepal (4.8%, a difference of 0.22%), Immigrants from Taiwan (4.8%, a difference of 0.24%), and Filipino (4.8%, a difference of 0.26%).
| Demographics | Rating | Rank | Unemployment |
| Czechoslovakians | 99.7 /100 | #37 | Exceptional 4.8% |
| Bolivians | 99.7 /100 | #38 | Exceptional 4.8% |
| Lithuanians | 99.7 /100 | #39 | Exceptional 4.8% |
| Northern Europeans | 99.7 /100 | #40 | Exceptional 4.8% |
| Immigrants | Bosnia and Herzegovina | 99.7 /100 | #41 | Exceptional 4.8% |
| Filipinos | 99.5 /100 | #42 | Exceptional 4.8% |
| Yugoslavians | 99.5 /100 | #43 | Exceptional 4.8% |
| Austrians | 99.5 /100 | #44 | Exceptional 4.8% |
| French | 99.5 /100 | #45 | Exceptional 4.8% |
| Immigrants | Nepal | 99.4 /100 | #46 | Exceptional 4.8% |
| Immigrants | Taiwan | 99.4 /100 | #47 | Exceptional 4.8% |
| Immigrants | Scotland | 99.3 /100 | #48 | Exceptional 4.9% |
| Immigrants | South Central Asia | 99.3 /100 | #49 | Exceptional 4.9% |
| French Canadians | 99.3 /100 | #50 | Exceptional 4.9% |
| Immigrants | Belgium | 99.2 /100 | #51 | Exceptional 4.9% |