Immigrants from Cameroon vs Immigrants Female Unemployment
COMPARE
Immigrants from Cameroon
Immigrants
Female Unemployment
Female Unemployment Comparison
Immigrants from Cameroon
Immigrants
5.7%
FEMALE UNEMPLOYMENT
0.6/ 100
METRIC RATING
255th/ 347
METRIC RANK
5.7%
FEMALE UNEMPLOYMENT
0.6/ 100
METRIC RATING
254th/ 347
METRIC RANK
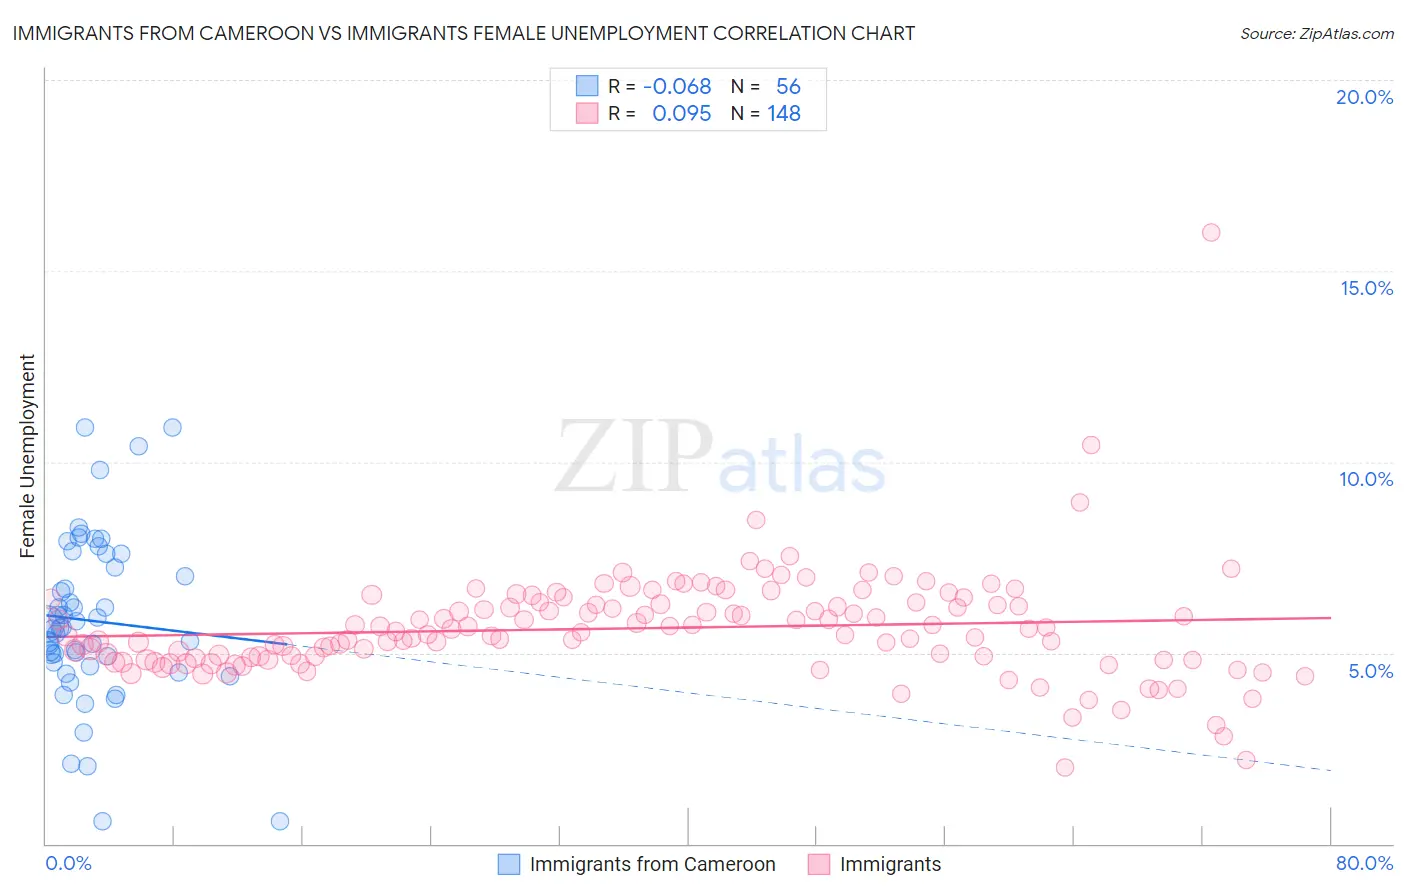
Immigrants from Cameroon vs Immigrants Female Unemployment Correlation Chart
The statistical analysis conducted on geographies consisting of 130,670,157 people shows a slight negative correlation between the proportion of Immigrants from Cameroon and unemploymnet rate among females in the United States with a correlation coefficient (R) of -0.068 and weighted average of 5.7%. Similarly, the statistical analysis conducted on geographies consisting of 563,480,166 people shows a slight positive correlation between the proportion of Immigrants and unemploymnet rate among females in the United States with a correlation coefficient (R) of 0.095 and weighted average of 5.7%, a difference of 0.040%.
Female Unemployment Correlation Summary
| Measurement | Immigrants from Cameroon | Immigrants |
| Minimum | 0.60% | 2.0% |
| Maximum | 10.9% | 16.0% |
| Range | 10.3% | 14.0% |
| Mean | 5.8% | 5.6% |
| Median | 5.6% | 5.5% |
| Interquartile 25% (IQ1) | 4.7% | 4.8% |
| Interquartile 75% (IQ3) | 7.4% | 6.3% |
| Interquartile Range (IQR) | 2.7% | 1.4% |
| Standard Deviation (Sample) | 2.2% | 1.4% |
| Standard Deviation (Population) | 2.2% | 1.4% |
Demographics Similar to Immigrants from Cameroon and Immigrants by Female Unemployment
In terms of female unemployment, the demographic groups most similar to Immigrants from Cameroon are Immigrants from Sierra Leone (5.7%, a difference of 0.040%), Cajun (5.7%, a difference of 0.18%), Assyrian/Chaldean/Syriac (5.6%, a difference of 0.38%), Immigrants from Syria (5.6%, a difference of 0.44%), and Subsaharan African (5.7%, a difference of 0.67%). Similarly, the demographic groups most similar to Immigrants are Immigrants from Sierra Leone (5.7%, a difference of 0.0%), Cajun (5.7%, a difference of 0.15%), Assyrian/Chaldean/Syriac (5.6%, a difference of 0.34%), Immigrants from Syria (5.6%, a difference of 0.41%), and Immigrants from Uzbekistan (5.6%, a difference of 0.70%).
| Demographics | Rating | Rank | Female Unemployment |
| Immigrants | Liberia | 1.5 /100 | #244 | Tragic 5.6% |
| Guamanians/Chamorros | 1.4 /100 | #245 | Tragic 5.6% |
| Japanese | 1.2 /100 | #246 | Tragic 5.6% |
| Immigrants | Western Asia | 1.1 /100 | #247 | Tragic 5.6% |
| Cree | 1.0 /100 | #248 | Tragic 5.6% |
| Immigrants | Uzbekistan | 1.0 /100 | #249 | Tragic 5.6% |
| Immigrants | Syria | 0.8 /100 | #250 | Tragic 5.6% |
| Assyrians/Chaldeans/Syriacs | 0.8 /100 | #251 | Tragic 5.6% |
| Cajuns | 0.7 /100 | #252 | Tragic 5.7% |
| Immigrants | Sierra Leone | 0.6 /100 | #253 | Tragic 5.7% |
| Immigrants | Immigrants | 0.6 /100 | #254 | Tragic 5.7% |
| Immigrants | Cameroon | 0.6 /100 | #255 | Tragic 5.7% |
| Sub-Saharan Africans | 0.4 /100 | #256 | Tragic 5.7% |
| Dutch West Indians | 0.3 /100 | #257 | Tragic 5.7% |
| Immigrants | Portugal | 0.2 /100 | #258 | Tragic 5.8% |
| Immigrants | Fiji | 0.2 /100 | #259 | Tragic 5.8% |
| Nigerians | 0.2 /100 | #260 | Tragic 5.8% |
| Kiowa | 0.1 /100 | #261 | Tragic 5.8% |
| Immigrants | Nigeria | 0.1 /100 | #262 | Tragic 5.8% |
| Immigrants | Azores | 0.1 /100 | #263 | Tragic 5.8% |
| Immigrants | Bahamas | 0.1 /100 | #264 | Tragic 5.8% |