Immigrants from Cambodia vs Immigrants from Chile Unemployment Among Women with Children Under 6 years
COMPARE
Immigrants from Cambodia
Immigrants from Chile
Unemployment Among Women with Children Under 6 years
Unemployment Among Women with Children Under 6 years Comparison
Immigrants from Cambodia
Immigrants from Chile
7.4%
UNEMPLOYMENT AMONG WOMEN WITH CHILDREN UNDER 6 YEARS
84.6/ 100
METRIC RATING
137th/ 347
METRIC RANK
7.3%
UNEMPLOYMENT AMONG WOMEN WITH CHILDREN UNDER 6 YEARS
93.5/ 100
METRIC RATING
121st/ 347
METRIC RANK
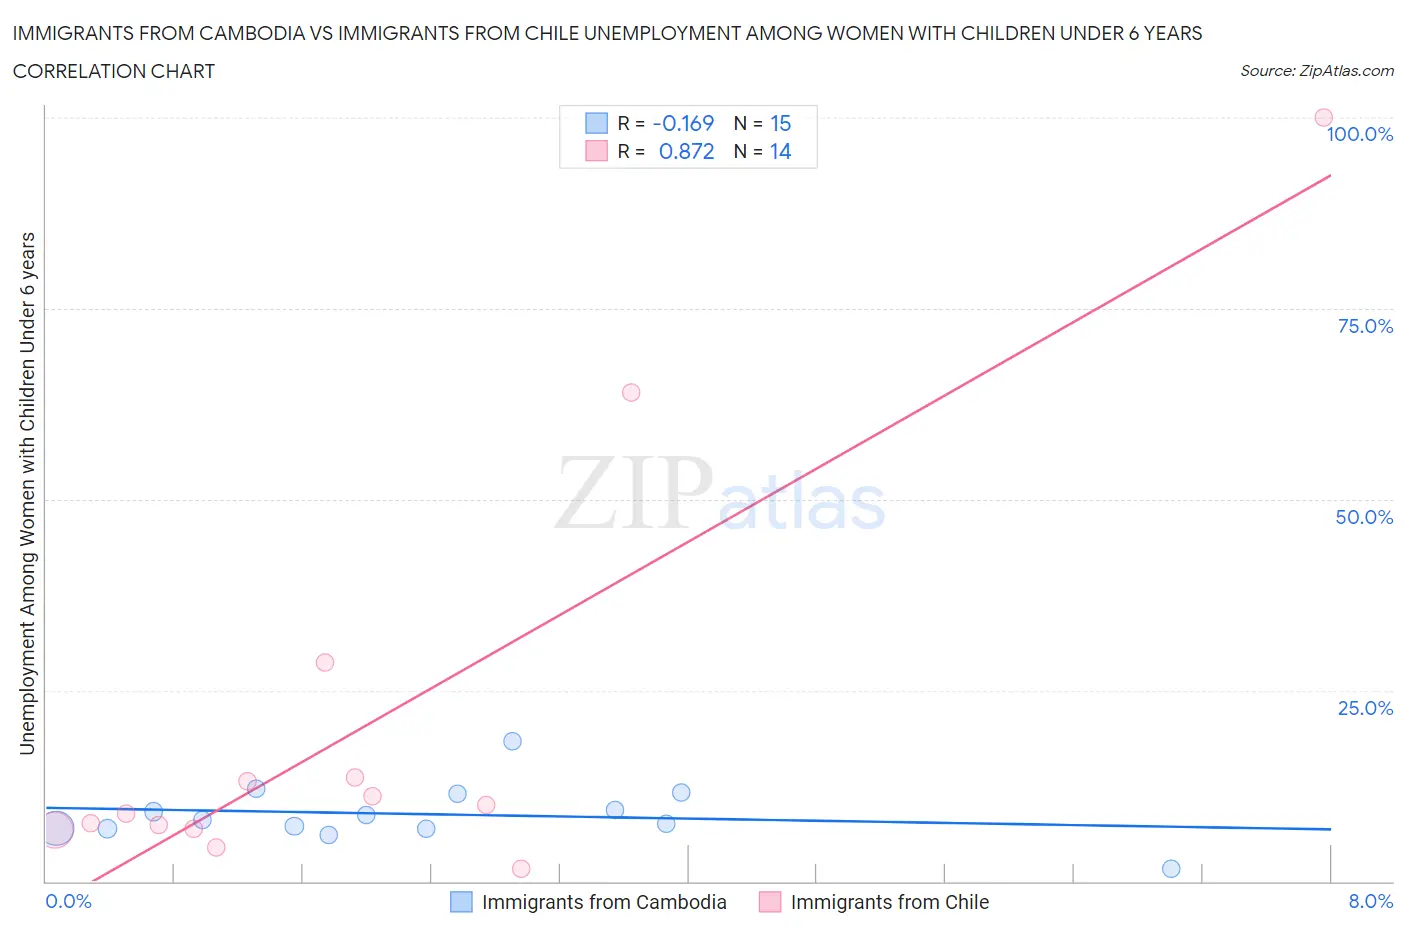
Immigrants from Cambodia vs Immigrants from Chile Unemployment Among Women with Children Under 6 years Correlation Chart
The statistical analysis conducted on geographies consisting of 176,492,322 people shows a poor negative correlation between the proportion of Immigrants from Cambodia and unemployment rate among women with children under the age of 6 in the United States with a correlation coefficient (R) of -0.169 and weighted average of 7.4%. Similarly, the statistical analysis conducted on geographies consisting of 184,982,304 people shows a very strong positive correlation between the proportion of Immigrants from Chile and unemployment rate among women with children under the age of 6 in the United States with a correlation coefficient (R) of 0.872 and weighted average of 7.3%, a difference of 1.7%.
Unemployment Among Women with Children Under 6 years Correlation Summary
| Measurement | Immigrants from Cambodia | Immigrants from Chile |
| Minimum | 1.7% | 1.6% |
| Maximum | 18.4% | 100.0% |
| Range | 16.7% | 98.4% |
| Mean | 8.8% | 20.3% |
| Median | 8.0% | 9.4% |
| Interquartile 25% (IQ1) | 6.9% | 6.9% |
| Interquartile 75% (IQ3) | 11.5% | 13.6% |
| Interquartile Range (IQR) | 4.5% | 6.7% |
| Standard Deviation (Sample) | 3.7% | 27.8% |
| Standard Deviation (Population) | 3.6% | 26.8% |
Demographics Similar to Immigrants from Cambodia and Immigrants from Chile by Unemployment Among Women with Children Under 6 years
In terms of unemployment among women with children under 6 years, the demographic groups most similar to Immigrants from Cambodia are Immigrants from Morocco (7.4%, a difference of 0.030%), Immigrants from Norway (7.4%, a difference of 0.070%), Immigrants from Northern Africa (7.4%, a difference of 0.090%), Immigrants from Colombia (7.4%, a difference of 0.090%), and Immigrants from Bolivia (7.4%, a difference of 0.15%). Similarly, the demographic groups most similar to Immigrants from Chile are Immigrants from Bosnia and Herzegovina (7.3%, a difference of 0.010%), Immigrants from Zaire (7.3%, a difference of 0.060%), Iraqi (7.3%, a difference of 0.12%), South African (7.3%, a difference of 0.19%), and Immigrants from South Africa (7.3%, a difference of 0.26%).
| Demographics | Rating | Rank | Unemployment Among Women with Children Under 6 years |
| South Africans | 94.1 /100 | #119 | Exceptional 7.3% |
| Iraqis | 93.9 /100 | #120 | Exceptional 7.3% |
| Immigrants | Chile | 93.5 /100 | #121 | Exceptional 7.3% |
| Immigrants | Bosnia and Herzegovina | 93.5 /100 | #122 | Exceptional 7.3% |
| Immigrants | Zaire | 93.3 /100 | #123 | Exceptional 7.3% |
| Immigrants | South Africa | 92.5 /100 | #124 | Exceptional 7.3% |
| Pakistanis | 92.2 /100 | #125 | Exceptional 7.3% |
| Immigrants | Burma/Myanmar | 91.9 /100 | #126 | Exceptional 7.3% |
| Jordanians | 91.5 /100 | #127 | Exceptional 7.3% |
| Zimbabweans | 91.5 /100 | #128 | Exceptional 7.3% |
| Slovenes | 89.2 /100 | #129 | Excellent 7.4% |
| Swedes | 88.4 /100 | #130 | Excellent 7.4% |
| Ukrainians | 88.2 /100 | #131 | Excellent 7.4% |
| Immigrants | Armenia | 87.4 /100 | #132 | Excellent 7.4% |
| Immigrants | Uganda | 86.5 /100 | #133 | Excellent 7.4% |
| Immigrants | Bolivia | 85.7 /100 | #134 | Excellent 7.4% |
| Immigrants | Northern Africa | 85.3 /100 | #135 | Excellent 7.4% |
| Immigrants | Morocco | 84.9 /100 | #136 | Excellent 7.4% |
| Immigrants | Cambodia | 84.6 /100 | #137 | Excellent 7.4% |
| Immigrants | Norway | 84.1 /100 | #138 | Excellent 7.4% |
| Immigrants | Colombia | 83.9 /100 | #139 | Excellent 7.4% |