Immigrants from Cambodia vs Immigrants from Western Africa Unemployment Among Women with Children Under 6 years
COMPARE
Immigrants from Cambodia
Immigrants from Western Africa
Unemployment Among Women with Children Under 6 years
Unemployment Among Women with Children Under 6 years Comparison
Immigrants from Cambodia
Immigrants from Western Africa
7.4%
UNEMPLOYMENT AMONG WOMEN WITH CHILDREN UNDER 6 YEARS
84.6/ 100
METRIC RATING
137th/ 347
METRIC RANK
8.2%
UNEMPLOYMENT AMONG WOMEN WITH CHILDREN UNDER 6 YEARS
1.1/ 100
METRIC RATING
248th/ 347
METRIC RANK
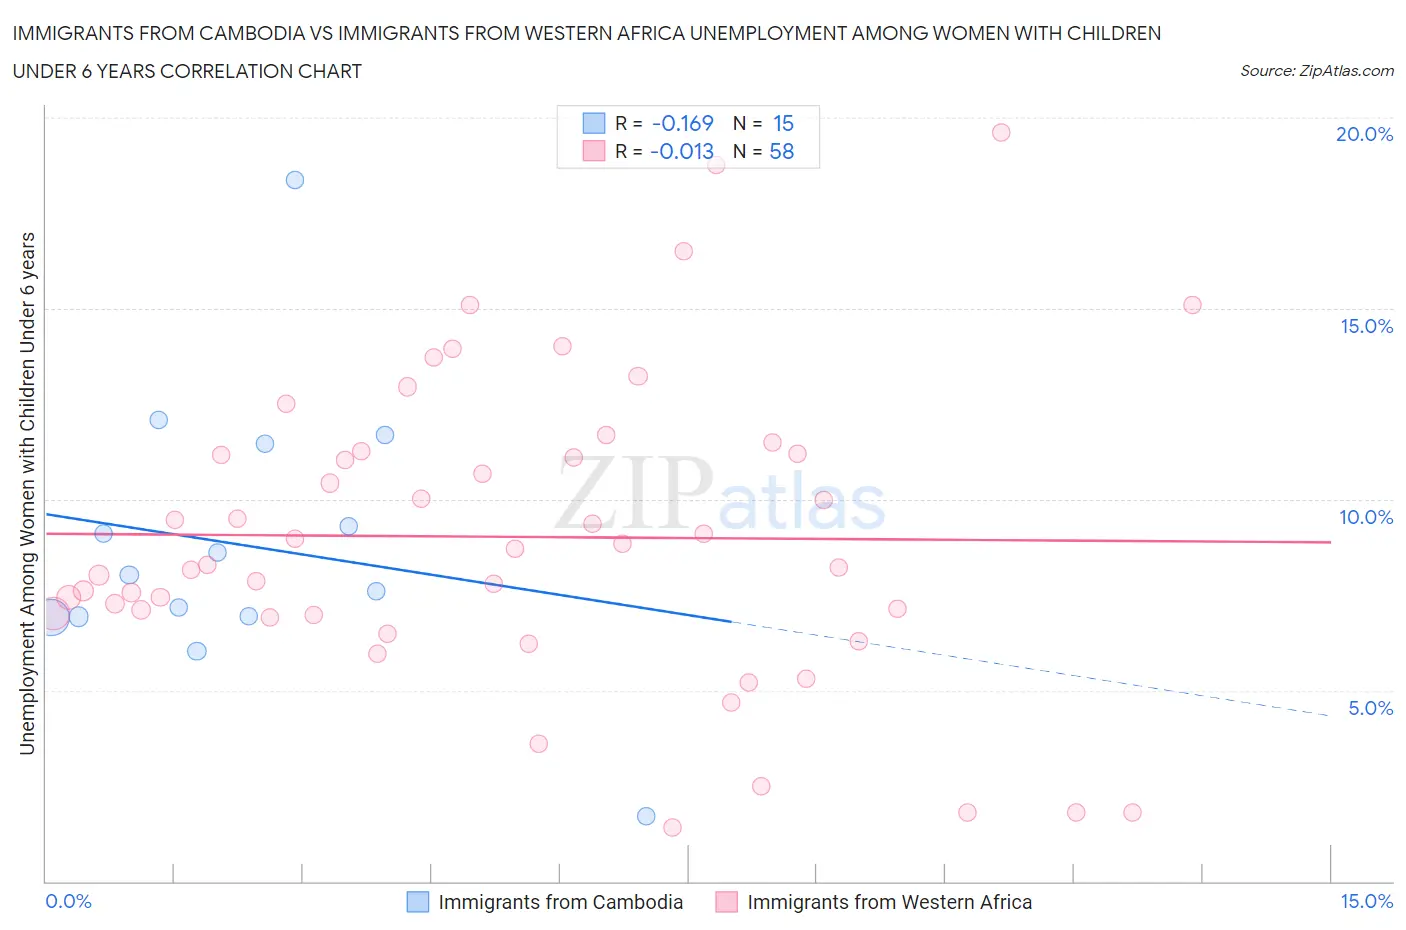
Immigrants from Cambodia vs Immigrants from Western Africa Unemployment Among Women with Children Under 6 years Correlation Chart
The statistical analysis conducted on geographies consisting of 176,492,322 people shows a poor negative correlation between the proportion of Immigrants from Cambodia and unemployment rate among women with children under the age of 6 in the United States with a correlation coefficient (R) of -0.169 and weighted average of 7.4%. Similarly, the statistical analysis conducted on geographies consisting of 284,723,749 people shows no correlation between the proportion of Immigrants from Western Africa and unemployment rate among women with children under the age of 6 in the United States with a correlation coefficient (R) of -0.013 and weighted average of 8.2%, a difference of 10.5%.
Unemployment Among Women with Children Under 6 years Correlation Summary
| Measurement | Immigrants from Cambodia | Immigrants from Western Africa |
| Minimum | 1.7% | 1.4% |
| Maximum | 18.4% | 19.6% |
| Range | 16.7% | 18.2% |
| Mean | 8.8% | 9.0% |
| Median | 8.0% | 8.5% |
| Interquartile 25% (IQ1) | 6.9% | 7.0% |
| Interquartile 75% (IQ3) | 11.5% | 11.2% |
| Interquartile Range (IQR) | 4.5% | 4.2% |
| Standard Deviation (Sample) | 3.7% | 4.0% |
| Standard Deviation (Population) | 3.6% | 3.9% |
Similar Demographics by Unemployment Among Women with Children Under 6 years
Demographics Similar to Immigrants from Cambodia by Unemployment Among Women with Children Under 6 years
In terms of unemployment among women with children under 6 years, the demographic groups most similar to Immigrants from Cambodia are Immigrants from Morocco (7.4%, a difference of 0.030%), Immigrants from Norway (7.4%, a difference of 0.070%), Immigrants from Northern Africa (7.4%, a difference of 0.090%), Immigrants from Colombia (7.4%, a difference of 0.090%), and Immigrants from Bolivia (7.4%, a difference of 0.15%).
| Demographics | Rating | Rank | Unemployment Among Women with Children Under 6 years |
| Swedes | 88.4 /100 | #130 | Excellent 7.4% |
| Ukrainians | 88.2 /100 | #131 | Excellent 7.4% |
| Immigrants | Armenia | 87.4 /100 | #132 | Excellent 7.4% |
| Immigrants | Uganda | 86.5 /100 | #133 | Excellent 7.4% |
| Immigrants | Bolivia | 85.7 /100 | #134 | Excellent 7.4% |
| Immigrants | Northern Africa | 85.3 /100 | #135 | Excellent 7.4% |
| Immigrants | Morocco | 84.9 /100 | #136 | Excellent 7.4% |
| Immigrants | Cambodia | 84.6 /100 | #137 | Excellent 7.4% |
| Immigrants | Norway | 84.1 /100 | #138 | Excellent 7.4% |
| Immigrants | Colombia | 83.9 /100 | #139 | Excellent 7.4% |
| Scandinavians | 83.0 /100 | #140 | Excellent 7.4% |
| Greeks | 82.6 /100 | #141 | Excellent 7.4% |
| Immigrants | Argentina | 81.5 /100 | #142 | Excellent 7.5% |
| Koreans | 81.3 /100 | #143 | Excellent 7.5% |
| Europeans | 79.1 /100 | #144 | Good 7.5% |
Demographics Similar to Immigrants from Western Africa by Unemployment Among Women with Children Under 6 years
In terms of unemployment among women with children under 6 years, the demographic groups most similar to Immigrants from Western Africa are German Russian (8.2%, a difference of 0.040%), Immigrants from Sierra Leone (8.2%, a difference of 0.090%), Nigerian (8.2%, a difference of 0.10%), Guyanese (8.2%, a difference of 0.27%), and Ghanaian (8.2%, a difference of 0.27%).
| Demographics | Rating | Rank | Unemployment Among Women with Children Under 6 years |
| Liberians | 2.6 /100 | #241 | Tragic 8.1% |
| Dutch | 2.5 /100 | #242 | Tragic 8.1% |
| Hawaiians | 1.8 /100 | #243 | Tragic 8.2% |
| French | 1.7 /100 | #244 | Tragic 8.2% |
| Native Hawaiians | 1.7 /100 | #245 | Tragic 8.2% |
| Central Americans | 1.4 /100 | #246 | Tragic 8.2% |
| German Russians | 1.2 /100 | #247 | Tragic 8.2% |
| Immigrants | Western Africa | 1.1 /100 | #248 | Tragic 8.2% |
| Immigrants | Sierra Leone | 1.1 /100 | #249 | Tragic 8.2% |
| Nigerians | 1.1 /100 | #250 | Tragic 8.2% |
| Guyanese | 1.0 /100 | #251 | Tragic 8.2% |
| Ghanaians | 1.0 /100 | #252 | Tragic 8.2% |
| Immigrants | Guyana | 0.8 /100 | #253 | Tragic 8.2% |
| Immigrants | Caribbean | 0.7 /100 | #254 | Tragic 8.3% |
| Immigrants | Portugal | 0.6 /100 | #255 | Tragic 8.3% |