French Canadian vs Guyanese Unemployment Among Ages 35 to 44 years
COMPARE
French Canadian
Guyanese
Unemployment Among Ages 35 to 44 years
Unemployment Among Ages 35 to 44 years Comparison
French Canadians
Guyanese
4.8%
UNEMPLOYMENT AMONG AGES 35 TO 44 YEARS
16.5/ 100
METRIC RATING
208th/ 347
METRIC RANK
5.9%
UNEMPLOYMENT AMONG AGES 35 TO 44 YEARS
0.0/ 100
METRIC RATING
310th/ 347
METRIC RANK
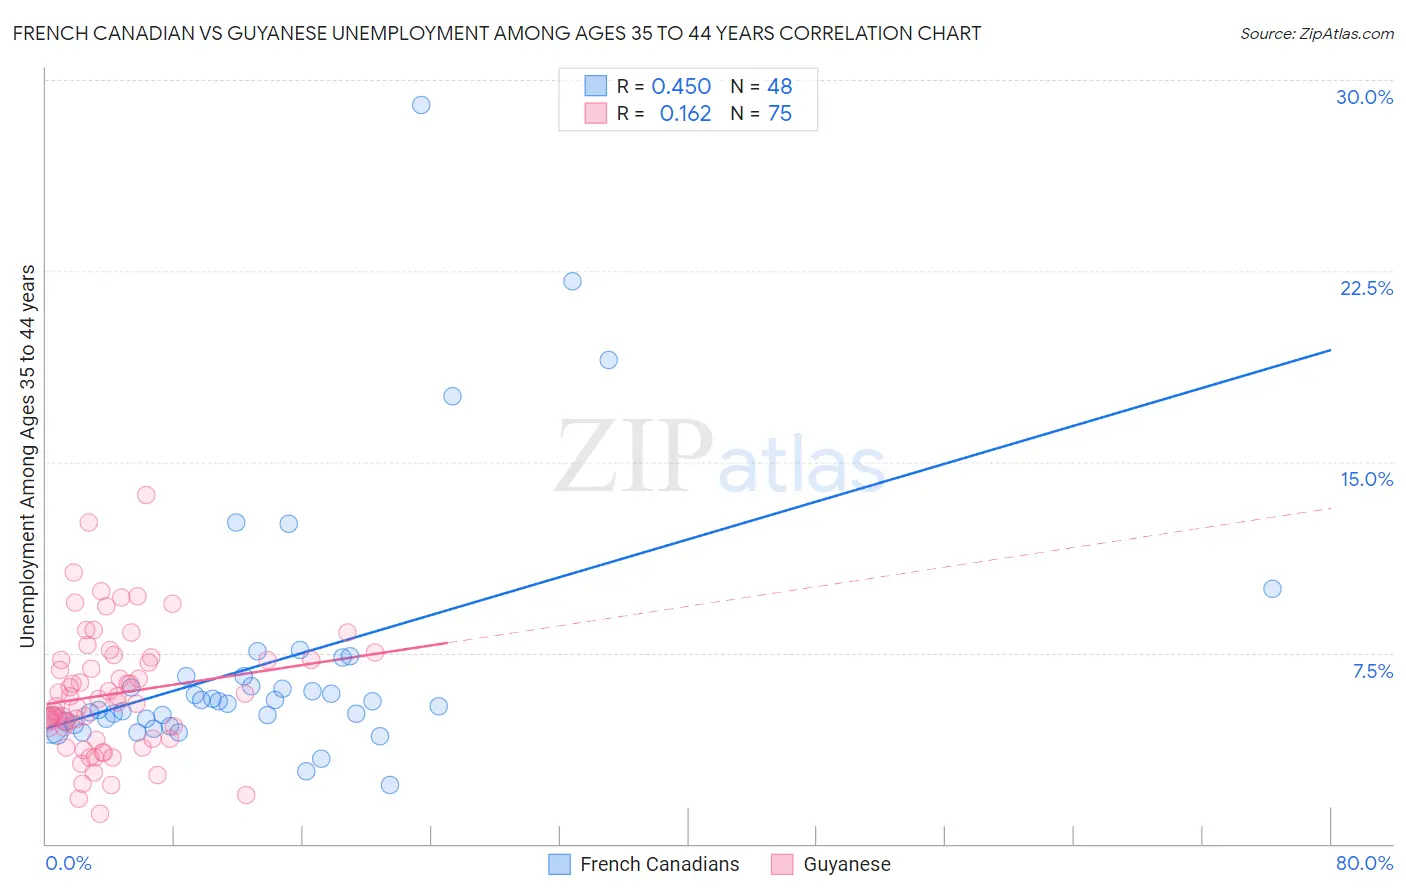
French Canadian vs Guyanese Unemployment Among Ages 35 to 44 years Correlation Chart
The statistical analysis conducted on geographies consisting of 478,615,928 people shows a moderate positive correlation between the proportion of French Canadians and unemployment rate among population between the ages 35 and 44 in the United States with a correlation coefficient (R) of 0.450 and weighted average of 4.8%. Similarly, the statistical analysis conducted on geographies consisting of 175,131,214 people shows a poor positive correlation between the proportion of Guyanese and unemployment rate among population between the ages 35 and 44 in the United States with a correlation coefficient (R) of 0.162 and weighted average of 5.9%, a difference of 22.0%.
Unemployment Among Ages 35 to 44 years Correlation Summary
| Measurement | French Canadian | Guyanese |
| Minimum | 2.3% | 1.2% |
| Maximum | 29.0% | 13.7% |
| Range | 26.7% | 12.5% |
| Mean | 7.1% | 5.9% |
| Median | 5.5% | 5.5% |
| Interquartile 25% (IQ1) | 4.7% | 4.1% |
| Interquartile 75% (IQ3) | 6.6% | 7.2% |
| Interquartile Range (IQR) | 1.8% | 3.1% |
| Standard Deviation (Sample) | 5.1% | 2.4% |
| Standard Deviation (Population) | 5.0% | 2.4% |
Similar Demographics by Unemployment Among Ages 35 to 44 years
Demographics Similar to French Canadians by Unemployment Among Ages 35 to 44 years
In terms of unemployment among ages 35 to 44 years, the demographic groups most similar to French Canadians are Immigrants from Western Asia (4.8%, a difference of 0.020%), Soviet Union (4.8%, a difference of 0.23%), Spaniard (4.8%, a difference of 0.27%), Immigrants from Philippines (4.8%, a difference of 0.39%), and Uruguayan (4.8%, a difference of 0.41%).
| Demographics | Rating | Rank | Unemployment Among Ages 35 to 44 years |
| Ugandans | 21.4 /100 | #201 | Fair 4.8% |
| Immigrants | Afghanistan | 20.2 /100 | #202 | Fair 4.8% |
| Uruguayans | 20.0 /100 | #203 | Fair 4.8% |
| Immigrants | Philippines | 19.8 /100 | #204 | Poor 4.8% |
| Spaniards | 18.7 /100 | #205 | Poor 4.8% |
| Soviet Union | 18.4 /100 | #206 | Poor 4.8% |
| Immigrants | Western Asia | 16.6 /100 | #207 | Poor 4.8% |
| French Canadians | 16.5 /100 | #208 | Poor 4.8% |
| Immigrants | Uruguay | 11.5 /100 | #209 | Poor 4.9% |
| Immigrants | Cameroon | 11.4 /100 | #210 | Poor 4.9% |
| Immigrants | Nonimmigrants | 9.4 /100 | #211 | Tragic 4.9% |
| Fijians | 8.7 /100 | #212 | Tragic 4.9% |
| Osage | 8.6 /100 | #213 | Tragic 4.9% |
| Immigrants | Africa | 8.2 /100 | #214 | Tragic 4.9% |
| Immigrants | Immigrants | 8.0 /100 | #215 | Tragic 4.9% |
Demographics Similar to Guyanese by Unemployment Among Ages 35 to 44 years
In terms of unemployment among ages 35 to 44 years, the demographic groups most similar to Guyanese are Marshallese (5.9%, a difference of 0.27%), Immigrants from Guyana (6.0%, a difference of 1.4%), British West Indian (6.0%, a difference of 1.5%), Immigrants from Barbados (5.8%, a difference of 1.7%), and Immigrants from Dominica (6.0%, a difference of 1.9%).
| Demographics | Rating | Rank | Unemployment Among Ages 35 to 44 years |
| Yakama | 0.0 /100 | #303 | Tragic 5.6% |
| West Indians | 0.0 /100 | #304 | Tragic 5.7% |
| Belizeans | 0.0 /100 | #305 | Tragic 5.7% |
| Barbadians | 0.0 /100 | #306 | Tragic 5.7% |
| Immigrants | Belize | 0.0 /100 | #307 | Tragic 5.8% |
| Immigrants | Azores | 0.0 /100 | #308 | Tragic 5.8% |
| Immigrants | Barbados | 0.0 /100 | #309 | Tragic 5.8% |
| Guyanese | 0.0 /100 | #310 | Tragic 5.9% |
| Marshallese | 0.0 /100 | #311 | Tragic 5.9% |
| Immigrants | Guyana | 0.0 /100 | #312 | Tragic 6.0% |
| British West Indians | 0.0 /100 | #313 | Tragic 6.0% |
| Immigrants | Dominica | 0.0 /100 | #314 | Tragic 6.0% |
| Blacks/African Americans | 0.0 /100 | #315 | Tragic 6.1% |
| Tsimshian | 0.0 /100 | #316 | Tragic 6.2% |
| Immigrants | St. Vincent and the Grenadines | 0.0 /100 | #317 | Tragic 6.2% |