Immigrants from Cabo Verde vs Immigrants from Kuwait Unemployment Among Ages 35 to 44 years
COMPARE
Immigrants from Cabo Verde
Immigrants from Kuwait
Unemployment Among Ages 35 to 44 years
Unemployment Among Ages 35 to 44 years Comparison
Immigrants from Cabo Verde
Immigrants from Kuwait
6.9%
UNEMPLOYMENT AMONG AGES 35 TO 44 YEARS
0.0/ 100
METRIC RATING
330th/ 347
METRIC RANK
4.3%
UNEMPLOYMENT AMONG AGES 35 TO 44 YEARS
99.5/ 100
METRIC RATING
23rd/ 347
METRIC RANK
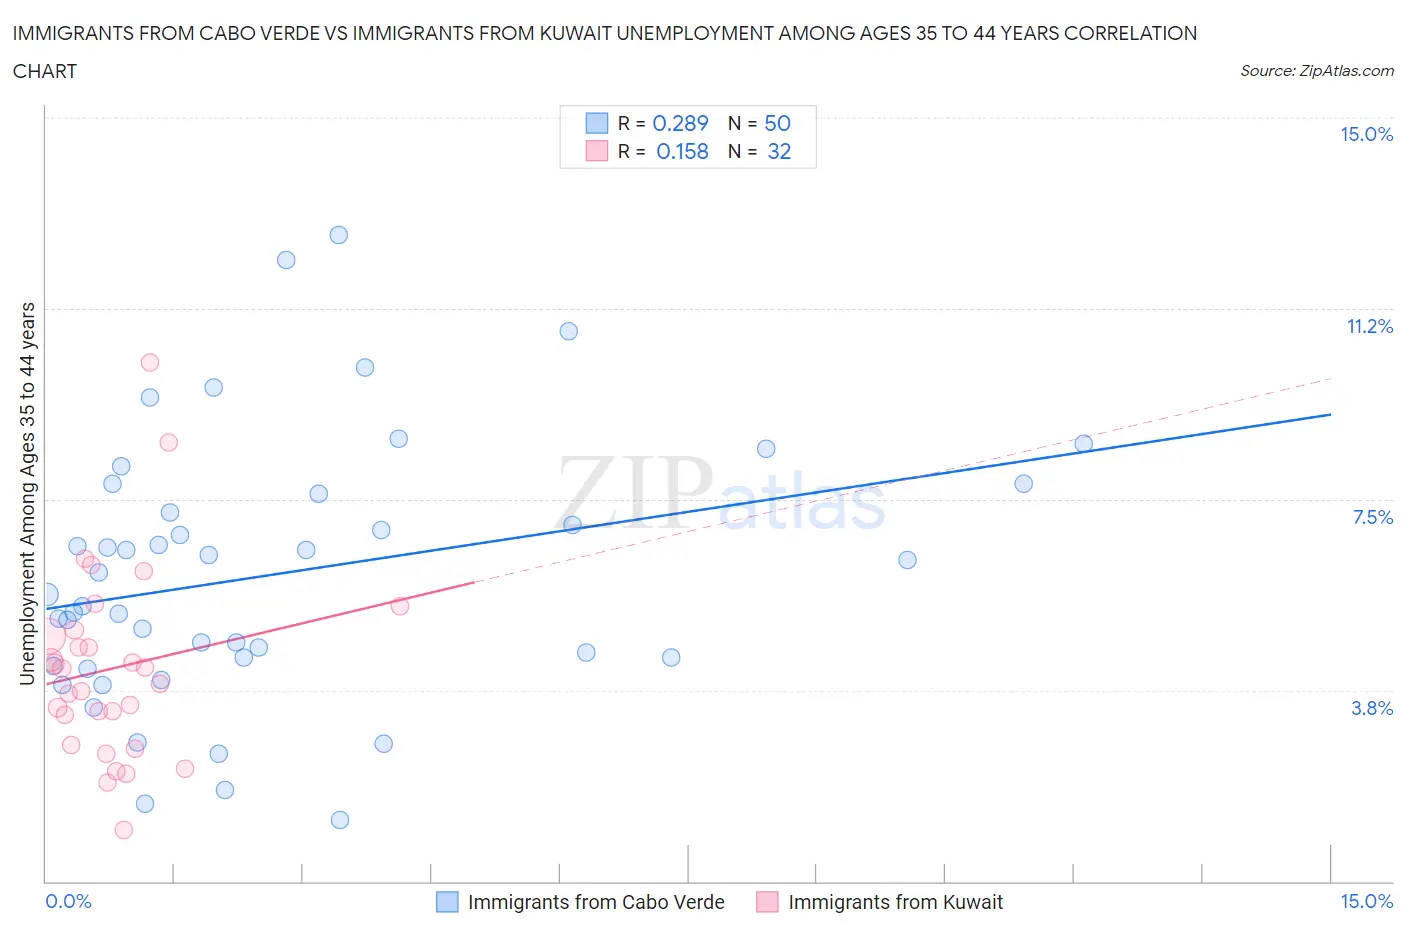
Immigrants from Cabo Verde vs Immigrants from Kuwait Unemployment Among Ages 35 to 44 years Correlation Chart
The statistical analysis conducted on geographies consisting of 37,842,833 people shows a weak positive correlation between the proportion of Immigrants from Cabo Verde and unemployment rate among population between the ages 35 and 44 in the United States with a correlation coefficient (R) of 0.289 and weighted average of 6.9%. Similarly, the statistical analysis conducted on geographies consisting of 136,247,564 people shows a poor positive correlation between the proportion of Immigrants from Kuwait and unemployment rate among population between the ages 35 and 44 in the United States with a correlation coefficient (R) of 0.158 and weighted average of 4.3%, a difference of 61.7%.
Unemployment Among Ages 35 to 44 years Correlation Summary
| Measurement | Immigrants from Cabo Verde | Immigrants from Kuwait |
| Minimum | 1.2% | 1.0% |
| Maximum | 12.7% | 10.2% |
| Range | 11.5% | 9.2% |
| Mean | 6.0% | 4.2% |
| Median | 5.9% | 4.0% |
| Interquartile 25% (IQ1) | 4.4% | 3.0% |
| Interquartile 75% (IQ3) | 7.6% | 4.9% |
| Interquartile Range (IQR) | 3.2% | 1.9% |
| Standard Deviation (Sample) | 2.6% | 1.9% |
| Standard Deviation (Population) | 2.6% | 1.9% |
Similar Demographics by Unemployment Among Ages 35 to 44 years
Demographics Similar to Immigrants from Cabo Verde by Unemployment Among Ages 35 to 44 years
In terms of unemployment among ages 35 to 44 years, the demographic groups most similar to Immigrants from Cabo Verde are Paiute (6.9%, a difference of 0.020%), Pueblo (7.1%, a difference of 2.5%), Shoshone (6.6%, a difference of 4.1%), Cape Verdean (6.6%, a difference of 4.8%), and Alaska Native (6.6%, a difference of 4.9%).
| Demographics | Rating | Rank | Unemployment Among Ages 35 to 44 years |
| Dominicans | 0.0 /100 | #323 | Tragic 6.4% |
| Menominee | 0.0 /100 | #324 | Tragic 6.5% |
| Immigrants | Yemen | 0.0 /100 | #325 | Tragic 6.6% |
| Alaska Natives | 0.0 /100 | #326 | Tragic 6.6% |
| Cape Verdeans | 0.0 /100 | #327 | Tragic 6.6% |
| Shoshone | 0.0 /100 | #328 | Tragic 6.6% |
| Paiute | 0.0 /100 | #329 | Tragic 6.9% |
| Immigrants | Cabo Verde | 0.0 /100 | #330 | Tragic 6.9% |
| Pueblo | 0.0 /100 | #331 | Tragic 7.1% |
| Natives/Alaskans | 0.0 /100 | #332 | Tragic 7.3% |
| Puerto Ricans | 0.0 /100 | #333 | Tragic 7.6% |
| Houma | 0.0 /100 | #334 | Tragic 7.8% |
| Sioux | 0.0 /100 | #335 | Tragic 8.4% |
| Apache | 0.0 /100 | #336 | Tragic 8.4% |
| Tohono O'odham | 0.0 /100 | #337 | Tragic 8.4% |
Demographics Similar to Immigrants from Kuwait by Unemployment Among Ages 35 to 44 years
In terms of unemployment among ages 35 to 44 years, the demographic groups most similar to Immigrants from Kuwait are Tlingit-Haida (4.3%, a difference of 0.010%), Scandinavian (4.2%, a difference of 0.15%), Paraguayan (4.2%, a difference of 0.41%), Bulgarian (4.3%, a difference of 0.48%), and Turkish (4.3%, a difference of 0.54%).
| Demographics | Rating | Rank | Unemployment Among Ages 35 to 44 years |
| Cubans | 99.8 /100 | #16 | Exceptional 4.2% |
| Swedes | 99.8 /100 | #17 | Exceptional 4.2% |
| Latvians | 99.8 /100 | #18 | Exceptional 4.2% |
| Immigrants | Nepal | 99.7 /100 | #19 | Exceptional 4.2% |
| Immigrants | Bolivia | 99.7 /100 | #20 | Exceptional 4.2% |
| Paraguayans | 99.6 /100 | #21 | Exceptional 4.2% |
| Scandinavians | 99.5 /100 | #22 | Exceptional 4.2% |
| Immigrants | Kuwait | 99.5 /100 | #23 | Exceptional 4.3% |
| Tlingit-Haida | 99.5 /100 | #24 | Exceptional 4.3% |
| Bulgarians | 99.3 /100 | #25 | Exceptional 4.3% |
| Turks | 99.3 /100 | #26 | Exceptional 4.3% |
| Assyrians/Chaldeans/Syriacs | 99.3 /100 | #27 | Exceptional 4.3% |
| Immigrants | Japan | 99.3 /100 | #28 | Exceptional 4.3% |
| Europeans | 99.2 /100 | #29 | Exceptional 4.3% |
| Immigrants | Pakistan | 99.2 /100 | #30 | Exceptional 4.3% |