Irish vs Guyanese Unemployment Among Ages 35 to 44 years
COMPARE
Irish
Guyanese
Unemployment Among Ages 35 to 44 years
Unemployment Among Ages 35 to 44 years Comparison
Irish
Guyanese
4.5%
UNEMPLOYMENT AMONG AGES 35 TO 44 YEARS
87.9/ 100
METRIC RATING
118th/ 347
METRIC RANK
5.9%
UNEMPLOYMENT AMONG AGES 35 TO 44 YEARS
0.0/ 100
METRIC RATING
310th/ 347
METRIC RANK
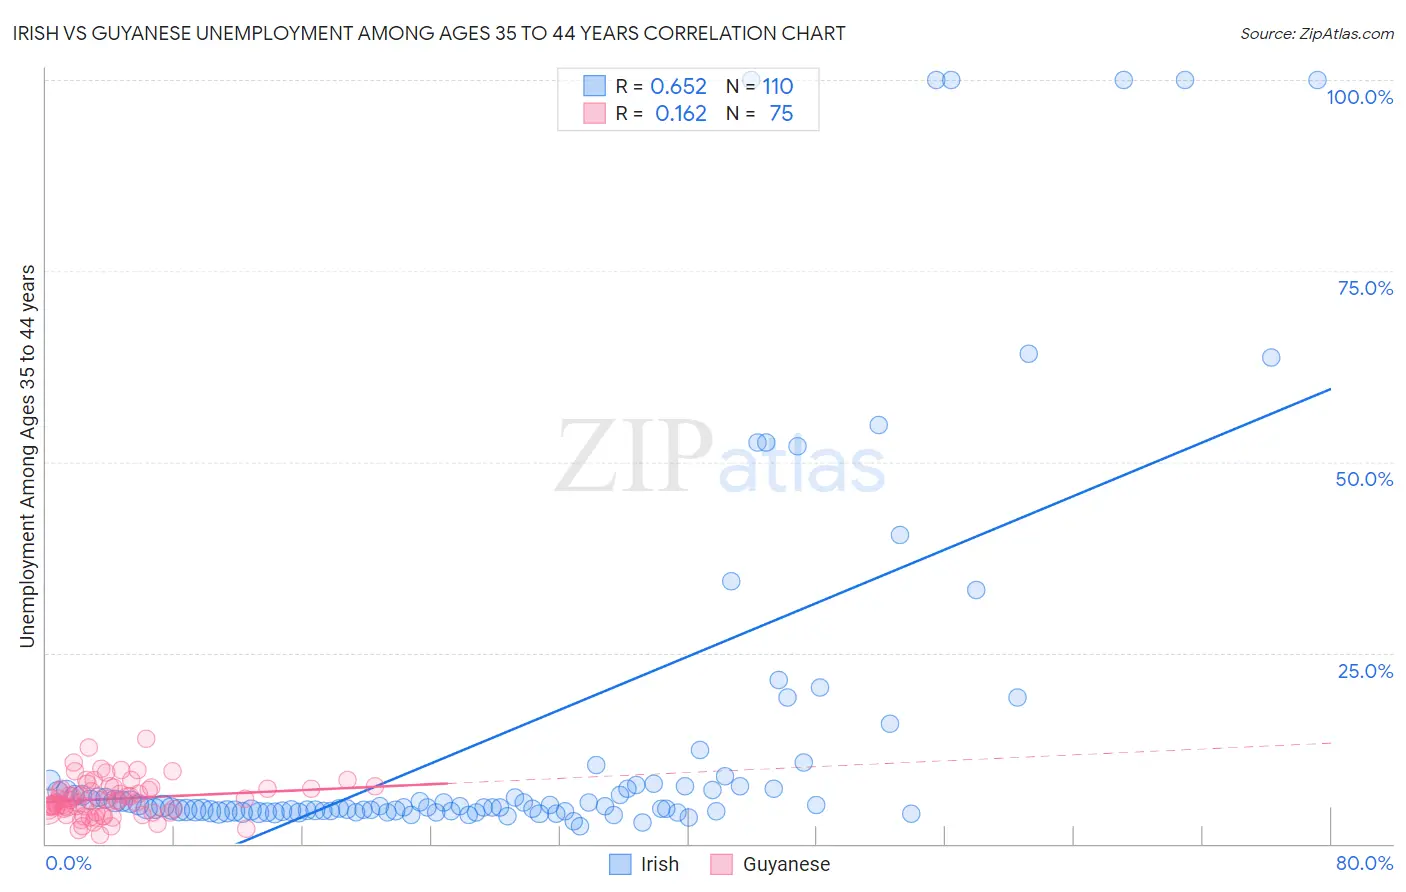
Irish vs Guyanese Unemployment Among Ages 35 to 44 years Correlation Chart
The statistical analysis conducted on geographies consisting of 536,805,359 people shows a significant positive correlation between the proportion of Irish and unemployment rate among population between the ages 35 and 44 in the United States with a correlation coefficient (R) of 0.652 and weighted average of 4.5%. Similarly, the statistical analysis conducted on geographies consisting of 175,131,214 people shows a poor positive correlation between the proportion of Guyanese and unemployment rate among population between the ages 35 and 44 in the United States with a correlation coefficient (R) of 0.162 and weighted average of 5.9%, a difference of 30.1%.
Unemployment Among Ages 35 to 44 years Correlation Summary
| Measurement | Irish | Guyanese |
| Minimum | 2.2% | 1.2% |
| Maximum | 100.0% | 13.7% |
| Range | 97.8% | 12.5% |
| Mean | 14.6% | 5.9% |
| Median | 4.8% | 5.5% |
| Interquartile 25% (IQ1) | 4.3% | 4.1% |
| Interquartile 75% (IQ3) | 7.6% | 7.2% |
| Interquartile Range (IQR) | 3.3% | 3.1% |
| Standard Deviation (Sample) | 24.3% | 2.4% |
| Standard Deviation (Population) | 24.2% | 2.4% |
Similar Demographics by Unemployment Among Ages 35 to 44 years
Demographics Similar to Irish by Unemployment Among Ages 35 to 44 years
In terms of unemployment among ages 35 to 44 years, the demographic groups most similar to Irish are Immigrants from Greece (4.5%, a difference of 0.010%), Immigrants from Israel (4.5%, a difference of 0.030%), Maltese (4.5%, a difference of 0.040%), Nicaraguan (4.5%, a difference of 0.050%), and Macedonian (4.5%, a difference of 0.070%).
| Demographics | Rating | Rank | Unemployment Among Ages 35 to 44 years |
| Immigrants | Nicaragua | 89.8 /100 | #111 | Excellent 4.5% |
| Immigrants | Czechoslovakia | 89.2 /100 | #112 | Excellent 4.5% |
| Immigrants | Italy | 88.4 /100 | #113 | Excellent 4.5% |
| Macedonians | 88.3 /100 | #114 | Excellent 4.5% |
| Maltese | 88.1 /100 | #115 | Excellent 4.5% |
| Immigrants | Israel | 88.1 /100 | #116 | Excellent 4.5% |
| Immigrants | Greece | 87.9 /100 | #117 | Excellent 4.5% |
| Irish | 87.9 /100 | #118 | Excellent 4.5% |
| Nicaraguans | 87.6 /100 | #119 | Excellent 4.5% |
| Ethiopians | 87.1 /100 | #120 | Excellent 4.5% |
| Immigrants | South Africa | 86.8 /100 | #121 | Excellent 4.5% |
| Sri Lankans | 86.8 /100 | #122 | Excellent 4.5% |
| Basques | 86.3 /100 | #123 | Excellent 4.5% |
| Immigrants | Spain | 86.1 /100 | #124 | Excellent 4.5% |
| Immigrants | Northern Africa | 86.1 /100 | #125 | Excellent 4.5% |
Demographics Similar to Guyanese by Unemployment Among Ages 35 to 44 years
In terms of unemployment among ages 35 to 44 years, the demographic groups most similar to Guyanese are Marshallese (5.9%, a difference of 0.27%), Immigrants from Guyana (6.0%, a difference of 1.4%), British West Indian (6.0%, a difference of 1.5%), Immigrants from Barbados (5.8%, a difference of 1.7%), and Immigrants from Dominica (6.0%, a difference of 1.9%).
| Demographics | Rating | Rank | Unemployment Among Ages 35 to 44 years |
| Yakama | 0.0 /100 | #303 | Tragic 5.6% |
| West Indians | 0.0 /100 | #304 | Tragic 5.7% |
| Belizeans | 0.0 /100 | #305 | Tragic 5.7% |
| Barbadians | 0.0 /100 | #306 | Tragic 5.7% |
| Immigrants | Belize | 0.0 /100 | #307 | Tragic 5.8% |
| Immigrants | Azores | 0.0 /100 | #308 | Tragic 5.8% |
| Immigrants | Barbados | 0.0 /100 | #309 | Tragic 5.8% |
| Guyanese | 0.0 /100 | #310 | Tragic 5.9% |
| Marshallese | 0.0 /100 | #311 | Tragic 5.9% |
| Immigrants | Guyana | 0.0 /100 | #312 | Tragic 6.0% |
| British West Indians | 0.0 /100 | #313 | Tragic 6.0% |
| Immigrants | Dominica | 0.0 /100 | #314 | Tragic 6.0% |
| Blacks/African Americans | 0.0 /100 | #315 | Tragic 6.1% |
| Tsimshian | 0.0 /100 | #316 | Tragic 6.2% |
| Immigrants | St. Vincent and the Grenadines | 0.0 /100 | #317 | Tragic 6.2% |