Immigrants from Burma/Myanmar vs Hmong Unemployment Among Ages 60 to 64 years
COMPARE
Immigrants from Burma/Myanmar
Hmong
Unemployment Among Ages 60 to 64 years
Unemployment Among Ages 60 to 64 years Comparison
Immigrants from Burma/Myanmar
Hmong
4.4%
UNEMPLOYMENT AMONG AGES 60 TO 64 YEARS
100.0/ 100
METRIC RATING
24th/ 347
METRIC RANK
4.0%
UNEMPLOYMENT AMONG AGES 60 TO 64 YEARS
100.0/ 100
METRIC RATING
4th/ 347
METRIC RANK
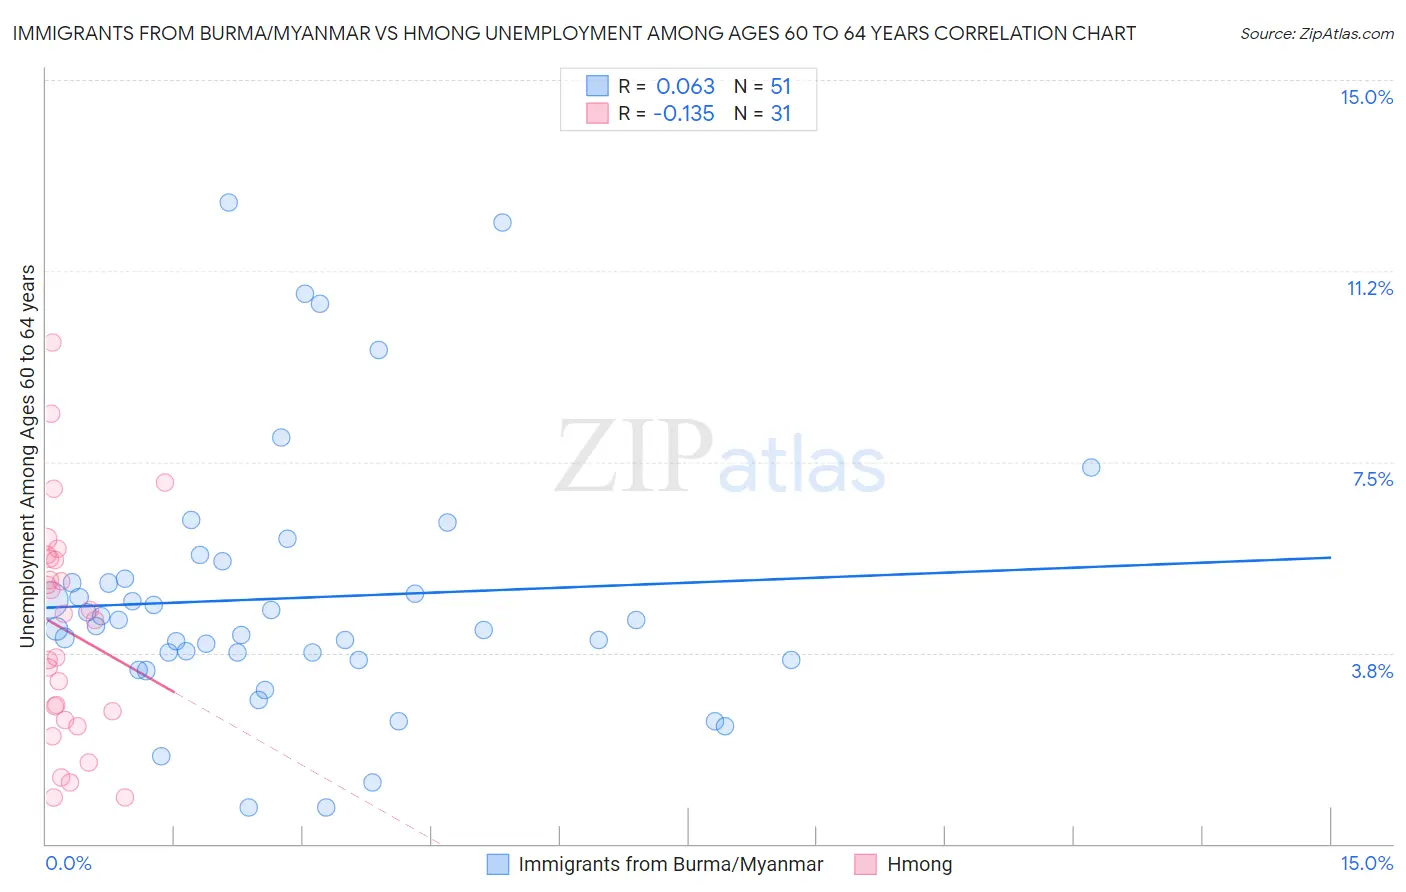
Immigrants from Burma/Myanmar vs Hmong Unemployment Among Ages 60 to 64 years Correlation Chart
The statistical analysis conducted on geographies consisting of 165,064,004 people shows a slight positive correlation between the proportion of Immigrants from Burma/Myanmar and unemployment rate among population between the ages 60 and 64 in the United States with a correlation coefficient (R) of 0.063 and weighted average of 4.4%. Similarly, the statistical analysis conducted on geographies consisting of 24,490,081 people shows a poor negative correlation between the proportion of Hmong and unemployment rate among population between the ages 60 and 64 in the United States with a correlation coefficient (R) of -0.135 and weighted average of 4.0%, a difference of 10.0%.
Unemployment Among Ages 60 to 64 years Correlation Summary
| Measurement | Immigrants from Burma/Myanmar | Hmong |
| Minimum | 0.70% | 0.90% |
| Maximum | 12.6% | 9.8% |
| Range | 11.9% | 8.9% |
| Mean | 4.8% | 4.2% |
| Median | 4.3% | 4.4% |
| Interquartile 25% (IQ1) | 3.6% | 2.4% |
| Interquartile 75% (IQ3) | 5.2% | 5.6% |
| Interquartile Range (IQR) | 1.6% | 3.2% |
| Standard Deviation (Sample) | 2.6% | 2.2% |
| Standard Deviation (Population) | 2.5% | 2.2% |
Demographics Similar to Immigrants from Burma/Myanmar and Hmong by Unemployment Among Ages 60 to 64 years
In terms of unemployment among ages 60 to 64 years, the demographic groups most similar to Immigrants from Burma/Myanmar are Immigrants from Zaire (4.4%, a difference of 0.23%), Cape Verdean (4.4%, a difference of 0.43%), Afghan (4.4%, a difference of 0.51%), Immigrants from Cabo Verde (4.4%, a difference of 0.51%), and Tsimshian (4.4%, a difference of 0.66%). Similarly, the demographic groups most similar to Hmong are Immigrants from the Azores (4.0%, a difference of 0.010%), Immigrants from Congo (4.1%, a difference of 2.7%), Lumbee (4.2%, a difference of 3.7%), Immigrants from Micronesia (4.2%, a difference of 4.9%), and Indonesian (4.2%, a difference of 5.4%).
| Demographics | Rating | Rank | Unemployment Among Ages 60 to 64 years |
| Hmong | 100.0 /100 | #4 | Exceptional 4.0% |
| Immigrants | Azores | 100.0 /100 | #5 | Exceptional 4.0% |
| Immigrants | Congo | 100.0 /100 | #6 | Exceptional 4.1% |
| Lumbee | 100.0 /100 | #7 | Exceptional 4.2% |
| Immigrants | Micronesia | 100.0 /100 | #8 | Exceptional 4.2% |
| Indonesians | 100.0 /100 | #9 | Exceptional 4.2% |
| Immigrants | Bosnia and Herzegovina | 100.0 /100 | #10 | Exceptional 4.2% |
| Luxembourgers | 100.0 /100 | #11 | Exceptional 4.3% |
| Immigrants | Cuba | 100.0 /100 | #12 | Exceptional 4.3% |
| Chickasaw | 100.0 /100 | #13 | Exceptional 4.3% |
| Norwegians | 100.0 /100 | #14 | Exceptional 4.3% |
| Sudanese | 100.0 /100 | #15 | Exceptional 4.3% |
| Danes | 100.0 /100 | #16 | Exceptional 4.4% |
| Immigrants | Afghanistan | 100.0 /100 | #17 | Exceptional 4.4% |
| Slovenes | 100.0 /100 | #18 | Exceptional 4.4% |
| Tsimshian | 100.0 /100 | #19 | Exceptional 4.4% |
| Afghans | 100.0 /100 | #20 | Exceptional 4.4% |
| Immigrants | Cabo Verde | 100.0 /100 | #21 | Exceptional 4.4% |
| Cape Verdeans | 100.0 /100 | #22 | Exceptional 4.4% |
| Immigrants | Zaire | 100.0 /100 | #23 | Exceptional 4.4% |
| Immigrants | Burma/Myanmar | 100.0 /100 | #24 | Exceptional 4.4% |