Immigrants from Burma/Myanmar vs Czech Unemployment Among Ages 60 to 64 years
COMPARE
Immigrants from Burma/Myanmar
Czech
Unemployment Among Ages 60 to 64 years
Unemployment Among Ages 60 to 64 years Comparison
Immigrants from Burma/Myanmar
Czechs
4.4%
UNEMPLOYMENT AMONG AGES 60 TO 64 YEARS
100.0/ 100
METRIC RATING
24th/ 347
METRIC RANK
4.4%
UNEMPLOYMENT AMONG AGES 60 TO 64 YEARS
100.0/ 100
METRIC RATING
26th/ 347
METRIC RANK
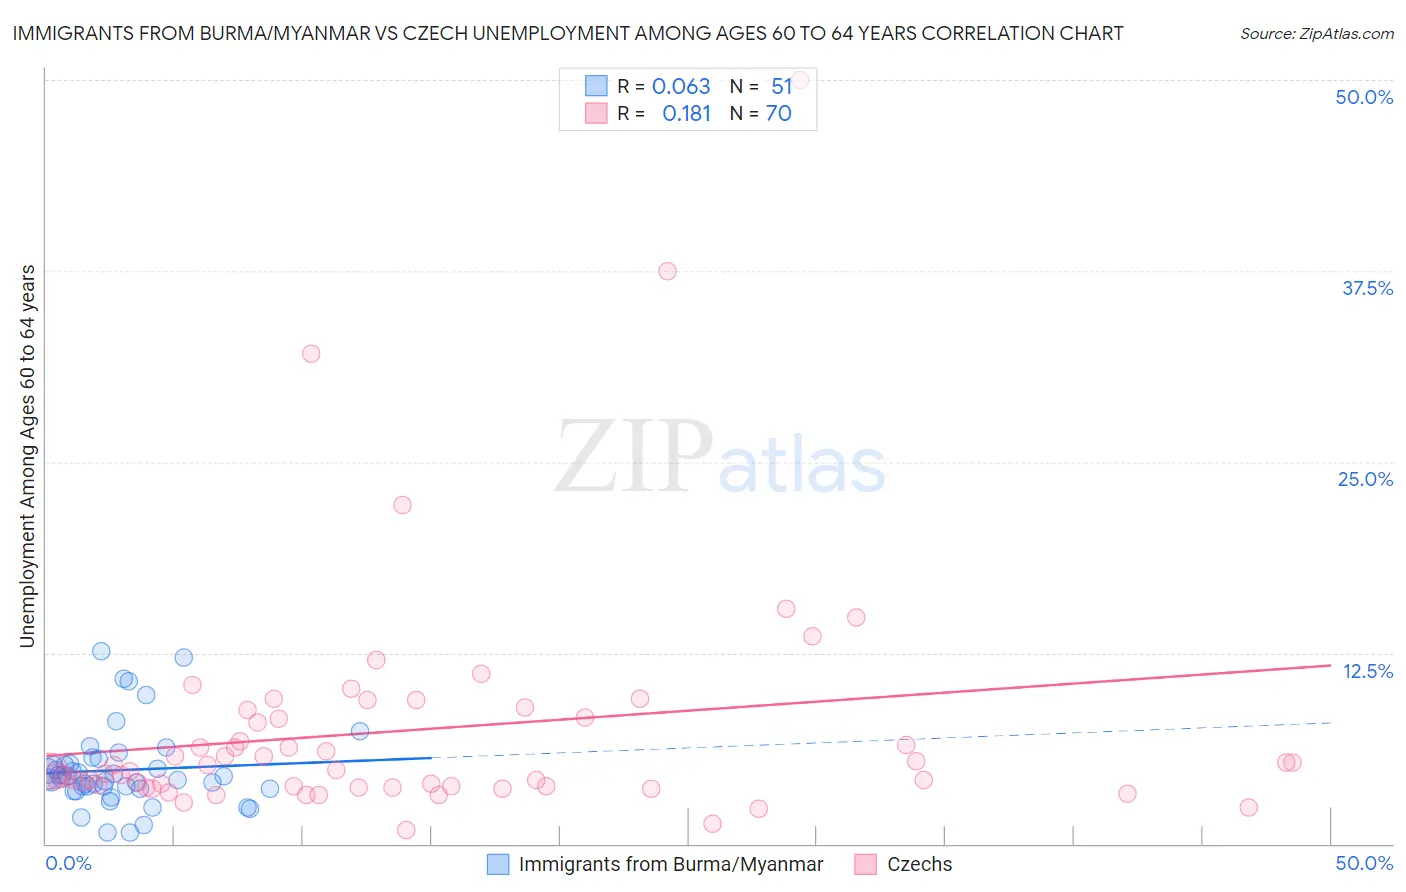
Immigrants from Burma/Myanmar vs Czech Unemployment Among Ages 60 to 64 years Correlation Chart
The statistical analysis conducted on geographies consisting of 165,064,004 people shows a slight positive correlation between the proportion of Immigrants from Burma/Myanmar and unemployment rate among population between the ages 60 and 64 in the United States with a correlation coefficient (R) of 0.063 and weighted average of 4.4%. Similarly, the statistical analysis conducted on geographies consisting of 416,417,760 people shows a poor positive correlation between the proportion of Czechs and unemployment rate among population between the ages 60 and 64 in the United States with a correlation coefficient (R) of 0.181 and weighted average of 4.4%, a difference of 0.74%.
Unemployment Among Ages 60 to 64 years Correlation Summary
| Measurement | Immigrants from Burma/Myanmar | Czech |
| Minimum | 0.70% | 0.87% |
| Maximum | 12.6% | 50.0% |
| Range | 11.9% | 49.1% |
| Mean | 4.8% | 7.5% |
| Median | 4.3% | 4.8% |
| Interquartile 25% (IQ1) | 3.6% | 3.7% |
| Interquartile 75% (IQ3) | 5.2% | 8.3% |
| Interquartile Range (IQR) | 1.6% | 4.6% |
| Standard Deviation (Sample) | 2.6% | 7.9% |
| Standard Deviation (Population) | 2.5% | 7.9% |
Demographics Similar to Immigrants from Burma/Myanmar and Czechs by Unemployment Among Ages 60 to 64 years
In terms of unemployment among ages 60 to 64 years, the demographic groups most similar to Immigrants from Burma/Myanmar are Immigrants from Zaire (4.4%, a difference of 0.23%), Cape Verdean (4.4%, a difference of 0.43%), Afghan (4.4%, a difference of 0.51%), Immigrants from Cabo Verde (4.4%, a difference of 0.51%), and Yugoslavian (4.4%, a difference of 0.64%). Similarly, the demographic groups most similar to Czechs are Immigrants from Iraq (4.5%, a difference of 0.080%), Yugoslavian (4.4%, a difference of 0.10%), Immigrants from Nepal (4.5%, a difference of 0.16%), Cuban (4.5%, a difference of 0.39%), and Immigrants from Venezuela (4.5%, a difference of 0.41%).
| Demographics | Rating | Rank | Unemployment Among Ages 60 to 64 years |
| Sudanese | 100.0 /100 | #15 | Exceptional 4.3% |
| Danes | 100.0 /100 | #16 | Exceptional 4.4% |
| Immigrants | Afghanistan | 100.0 /100 | #17 | Exceptional 4.4% |
| Slovenes | 100.0 /100 | #18 | Exceptional 4.4% |
| Tsimshian | 100.0 /100 | #19 | Exceptional 4.4% |
| Afghans | 100.0 /100 | #20 | Exceptional 4.4% |
| Immigrants | Cabo Verde | 100.0 /100 | #21 | Exceptional 4.4% |
| Cape Verdeans | 100.0 /100 | #22 | Exceptional 4.4% |
| Immigrants | Zaire | 100.0 /100 | #23 | Exceptional 4.4% |
| Immigrants | Burma/Myanmar | 100.0 /100 | #24 | Exceptional 4.4% |
| Yugoslavians | 100.0 /100 | #25 | Exceptional 4.4% |
| Czechs | 100.0 /100 | #26 | Exceptional 4.4% |
| Immigrants | Iraq | 100.0 /100 | #27 | Exceptional 4.5% |
| Immigrants | Nepal | 100.0 /100 | #28 | Exceptional 4.5% |
| Cubans | 100.0 /100 | #29 | Exceptional 4.5% |
| Immigrants | Venezuela | 100.0 /100 | #30 | Exceptional 4.5% |
| Immigrants | Eritrea | 100.0 /100 | #31 | Exceptional 4.5% |
| Zimbabweans | 100.0 /100 | #32 | Exceptional 4.5% |
| Carpatho Rusyns | 100.0 /100 | #33 | Exceptional 4.5% |
| Belgians | 100.0 /100 | #34 | Exceptional 4.5% |
| Germans | 100.0 /100 | #35 | Exceptional 4.5% |