Peruvian vs Immigrants from Cuba Unemployment Among Seniors over 75 years
COMPARE
Peruvian
Immigrants from Cuba
Unemployment Among Seniors over 75 years
Unemployment Among Seniors over 75 years Comparison
Peruvians
Immigrants from Cuba
9.0%
UNEMPLOYMENT AMONG SENIORS OVER 75 YEARS
7.3/ 100
METRIC RATING
222nd/ 347
METRIC RANK
7.4%
UNEMPLOYMENT AMONG SENIORS OVER 75 YEARS
100.0/ 100
METRIC RATING
24th/ 347
METRIC RANK
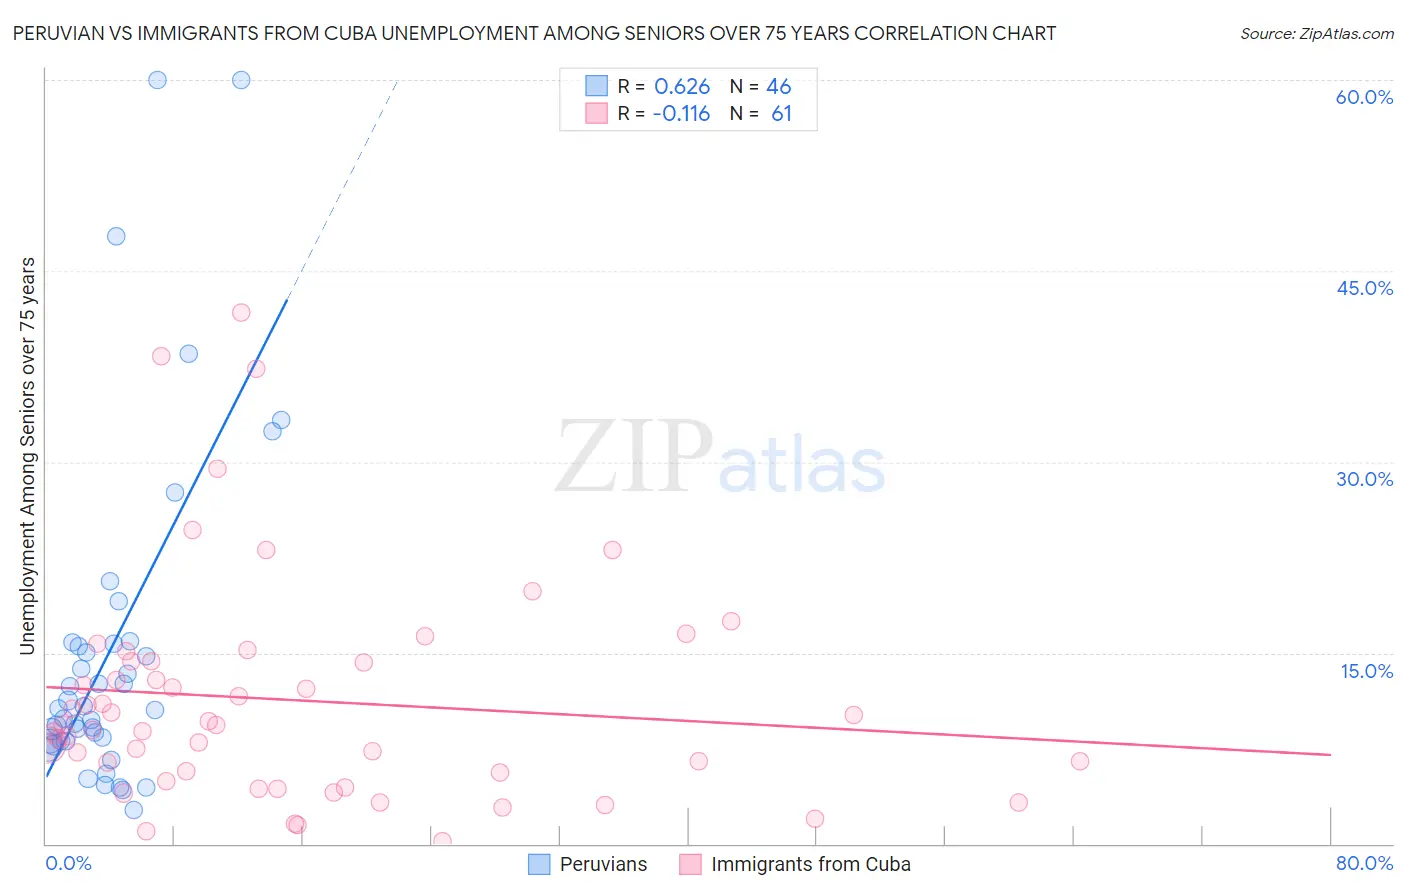
Peruvian vs Immigrants from Cuba Unemployment Among Seniors over 75 years Correlation Chart
The statistical analysis conducted on geographies consisting of 193,571,064 people shows a significant positive correlation between the proportion of Peruvians and unemployment rate among seniors over the age of 75 in the United States with a correlation coefficient (R) of 0.626 and weighted average of 9.0%. Similarly, the statistical analysis conducted on geographies consisting of 178,826,152 people shows a poor negative correlation between the proportion of Immigrants from Cuba and unemployment rate among seniors over the age of 75 in the United States with a correlation coefficient (R) of -0.116 and weighted average of 7.4%, a difference of 21.7%.
Unemployment Among Seniors over 75 years Correlation Summary
| Measurement | Peruvian | Immigrants from Cuba |
| Minimum | 2.7% | 0.20% |
| Maximum | 60.0% | 41.7% |
| Range | 57.3% | 41.5% |
| Mean | 15.2% | 11.3% |
| Median | 10.6% | 9.3% |
| Interquartile 25% (IQ1) | 8.1% | 5.2% |
| Interquartile 75% (IQ3) | 15.7% | 14.3% |
| Interquartile Range (IQR) | 7.6% | 9.1% |
| Standard Deviation (Sample) | 13.4% | 8.8% |
| Standard Deviation (Population) | 13.2% | 8.8% |
Similar Demographics by Unemployment Among Seniors over 75 years
Demographics Similar to Peruvians by Unemployment Among Seniors over 75 years
In terms of unemployment among seniors over 75 years, the demographic groups most similar to Peruvians are Guamanian/Chamorro (9.0%, a difference of 0.070%), Immigrants from Jordan (9.0%, a difference of 0.070%), Immigrants from Zimbabwe (9.0%, a difference of 0.10%), Afghan (9.0%, a difference of 0.18%), and Costa Rican (9.1%, a difference of 0.20%).
| Demographics | Rating | Rank | Unemployment Among Seniors over 75 years |
| Immigrants | Western Asia | 12.5 /100 | #215 | Poor 9.0% |
| Immigrants | Oceania | 11.8 /100 | #216 | Poor 9.0% |
| Lebanese | 11.1 /100 | #217 | Poor 9.0% |
| Immigrants | Africa | 9.7 /100 | #218 | Tragic 9.0% |
| Afghans | 8.3 /100 | #219 | Tragic 9.0% |
| Immigrants | Zimbabwe | 7.8 /100 | #220 | Tragic 9.0% |
| Guamanians/Chamorros | 7.7 /100 | #221 | Tragic 9.0% |
| Peruvians | 7.3 /100 | #222 | Tragic 9.0% |
| Immigrants | Jordan | 6.9 /100 | #223 | Tragic 9.0% |
| Costa Ricans | 6.3 /100 | #224 | Tragic 9.1% |
| Navajo | 6.1 /100 | #225 | Tragic 9.1% |
| Immigrants | Bangladesh | 5.9 /100 | #226 | Tragic 9.1% |
| Samoans | 5.7 /100 | #227 | Tragic 9.1% |
| Kenyans | 5.4 /100 | #228 | Tragic 9.1% |
| Hispanics or Latinos | 5.0 /100 | #229 | Tragic 9.1% |
Demographics Similar to Immigrants from Cuba by Unemployment Among Seniors over 75 years
In terms of unemployment among seniors over 75 years, the demographic groups most similar to Immigrants from Cuba are Israeli (7.4%, a difference of 0.080%), Cypriot (7.4%, a difference of 0.41%), Immigrants from Uruguay (7.5%, a difference of 1.1%), Chickasaw (7.3%, a difference of 1.2%), and South African (7.5%, a difference of 1.3%).
| Demographics | Rating | Rank | Unemployment Among Seniors over 75 years |
| Immigrants | Switzerland | 100.0 /100 | #17 | Exceptional 7.2% |
| Immigrants | Uzbekistan | 100.0 /100 | #18 | Exceptional 7.2% |
| Immigrants | Zaire | 100.0 /100 | #19 | Exceptional 7.2% |
| Armenians | 100.0 /100 | #20 | Exceptional 7.2% |
| Chickasaw | 100.0 /100 | #21 | Exceptional 7.3% |
| Cypriots | 100.0 /100 | #22 | Exceptional 7.4% |
| Israelis | 100.0 /100 | #23 | Exceptional 7.4% |
| Immigrants | Cuba | 100.0 /100 | #24 | Exceptional 7.4% |
| Immigrants | Uruguay | 100.0 /100 | #25 | Exceptional 7.5% |
| South Africans | 100.0 /100 | #26 | Exceptional 7.5% |
| Immigrants | Barbados | 100.0 /100 | #27 | Exceptional 7.6% |
| Immigrants | Israel | 100.0 /100 | #28 | Exceptional 7.6% |
| Immigrants | Iran | 100.0 /100 | #29 | Exceptional 7.6% |
| Immigrants | Sweden | 100.0 /100 | #30 | Exceptional 7.6% |
| Guyanese | 100.0 /100 | #31 | Exceptional 7.6% |