Native/Alaskan vs Hmong Unemployment Among Ages 60 to 64 years
COMPARE
Native/Alaskan
Hmong
Unemployment Among Ages 60 to 64 years
Unemployment Among Ages 60 to 64 years Comparison
Natives/Alaskans
Hmong
5.7%
UNEMPLOYMENT AMONG AGES 60 TO 64 YEARS
0.0/ 100
METRIC RATING
318th/ 347
METRIC RANK
4.0%
UNEMPLOYMENT AMONG AGES 60 TO 64 YEARS
100.0/ 100
METRIC RATING
4th/ 347
METRIC RANK
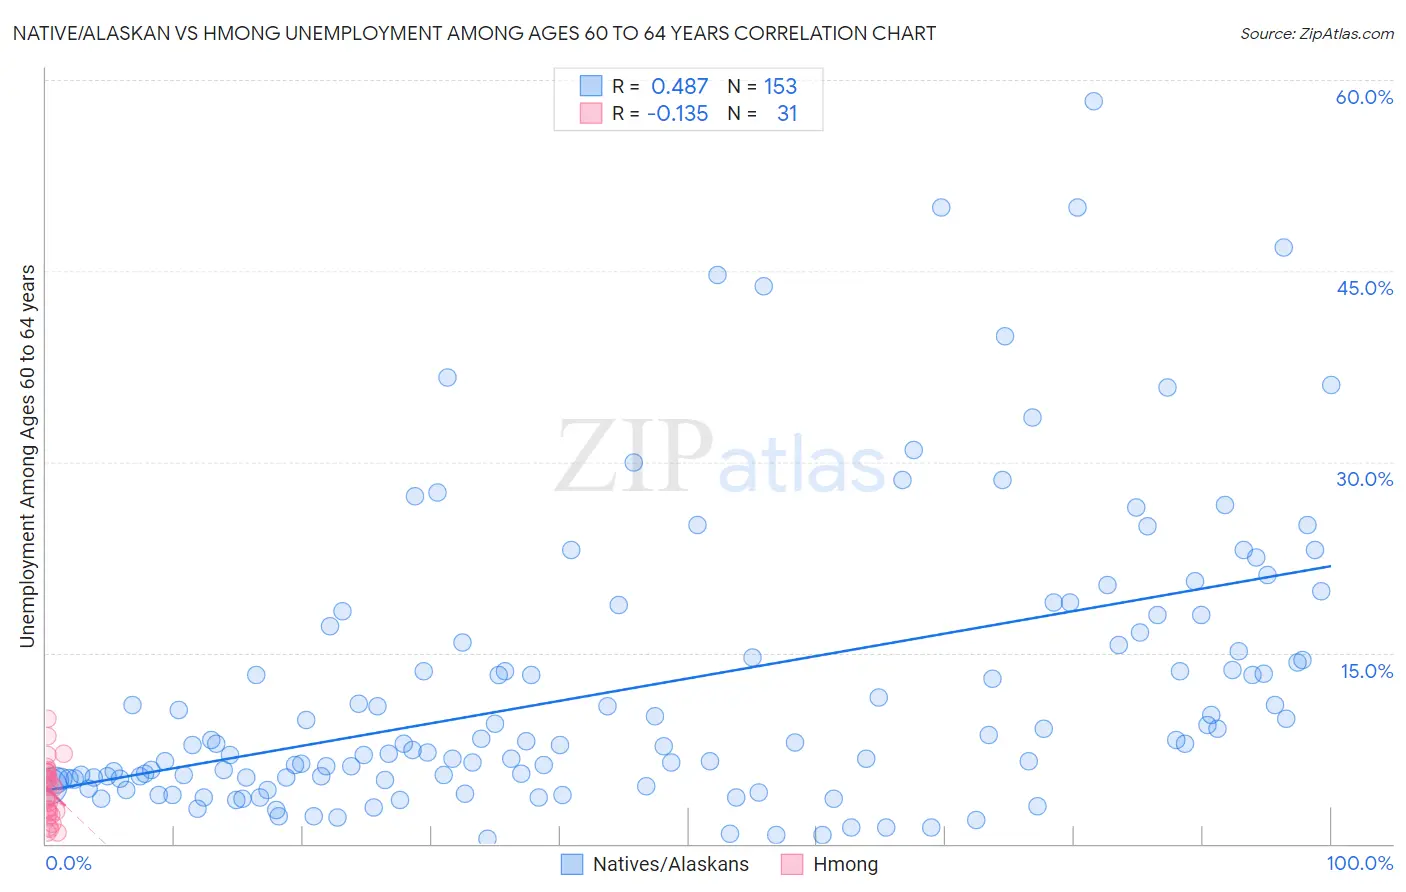
Native/Alaskan vs Hmong Unemployment Among Ages 60 to 64 years Correlation Chart
The statistical analysis conducted on geographies consisting of 437,522,212 people shows a moderate positive correlation between the proportion of Natives/Alaskans and unemployment rate among population between the ages 60 and 64 in the United States with a correlation coefficient (R) of 0.487 and weighted average of 5.7%. Similarly, the statistical analysis conducted on geographies consisting of 24,490,081 people shows a poor negative correlation between the proportion of Hmong and unemployment rate among population between the ages 60 and 64 in the United States with a correlation coefficient (R) of -0.135 and weighted average of 4.0%, a difference of 40.9%.
Unemployment Among Ages 60 to 64 years Correlation Summary
| Measurement | Native/Alaskan | Hmong |
| Minimum | 0.40% | 0.90% |
| Maximum | 58.3% | 9.8% |
| Range | 57.9% | 8.9% |
| Mean | 12.4% | 4.2% |
| Median | 7.9% | 4.4% |
| Interquartile 25% (IQ1) | 5.1% | 2.4% |
| Interquartile 75% (IQ3) | 16.2% | 5.6% |
| Interquartile Range (IQR) | 11.1% | 3.2% |
| Standard Deviation (Sample) | 11.4% | 2.2% |
| Standard Deviation (Population) | 11.3% | 2.2% |
Similar Demographics by Unemployment Among Ages 60 to 64 years
Demographics Similar to Natives/Alaskans by Unemployment Among Ages 60 to 64 years
In terms of unemployment among ages 60 to 64 years, the demographic groups most similar to Natives/Alaskans are Shoshone (5.7%, a difference of 0.050%), Immigrants from Belize (5.7%, a difference of 0.49%), Cheyenne (5.6%, a difference of 0.91%), Colville (5.7%, a difference of 1.3%), and Cree (5.6%, a difference of 1.3%).
| Demographics | Rating | Rank | Unemployment Among Ages 60 to 64 years |
| U.S. Virgin Islanders | 0.0 /100 | #311 | Tragic 5.5% |
| Immigrants | West Indies | 0.0 /100 | #312 | Tragic 5.5% |
| Belizeans | 0.0 /100 | #313 | Tragic 5.5% |
| Guyanese | 0.0 /100 | #314 | Tragic 5.5% |
| Cree | 0.0 /100 | #315 | Tragic 5.6% |
| Cheyenne | 0.0 /100 | #316 | Tragic 5.6% |
| Shoshone | 0.0 /100 | #317 | Tragic 5.7% |
| Natives/Alaskans | 0.0 /100 | #318 | Tragic 5.7% |
| Immigrants | Belize | 0.0 /100 | #319 | Tragic 5.7% |
| Colville | 0.0 /100 | #320 | Tragic 5.7% |
| Dutch West Indians | 0.0 /100 | #321 | Tragic 5.7% |
| Ecuadorians | 0.0 /100 | #322 | Tragic 5.8% |
| Alsatians | 0.0 /100 | #323 | Tragic 5.8% |
| Immigrants | Ecuador | 0.0 /100 | #324 | Tragic 5.8% |
| Paiute | 0.0 /100 | #325 | Tragic 5.8% |
Demographics Similar to Hmong by Unemployment Among Ages 60 to 64 years
In terms of unemployment among ages 60 to 64 years, the demographic groups most similar to Hmong are Immigrants from the Azores (4.0%, a difference of 0.010%), Chinese (4.0%, a difference of 0.42%), Immigrants from Congo (4.1%, a difference of 2.7%), Fijian (3.9%, a difference of 3.3%), and Lumbee (4.2%, a difference of 3.7%).
| Demographics | Rating | Rank | Unemployment Among Ages 60 to 64 years |
| Marshallese | 100.0 /100 | #1 | Exceptional 3.7% |
| Fijians | 100.0 /100 | #2 | Exceptional 3.9% |
| Chinese | 100.0 /100 | #3 | Exceptional 4.0% |
| Hmong | 100.0 /100 | #4 | Exceptional 4.0% |
| Immigrants | Azores | 100.0 /100 | #5 | Exceptional 4.0% |
| Immigrants | Congo | 100.0 /100 | #6 | Exceptional 4.1% |
| Lumbee | 100.0 /100 | #7 | Exceptional 4.2% |
| Immigrants | Micronesia | 100.0 /100 | #8 | Exceptional 4.2% |
| Indonesians | 100.0 /100 | #9 | Exceptional 4.2% |
| Immigrants | Bosnia and Herzegovina | 100.0 /100 | #10 | Exceptional 4.2% |
| Luxembourgers | 100.0 /100 | #11 | Exceptional 4.3% |
| Immigrants | Cuba | 100.0 /100 | #12 | Exceptional 4.3% |
| Chickasaw | 100.0 /100 | #13 | Exceptional 4.3% |
| Norwegians | 100.0 /100 | #14 | Exceptional 4.3% |
| Sudanese | 100.0 /100 | #15 | Exceptional 4.3% |