Immigrants from Bangladesh vs Samoan Male Unemployment
COMPARE
Immigrants from Bangladesh
Samoan
Male Unemployment
Male Unemployment Comparison
Immigrants from Bangladesh
Samoans
6.6%
MALE UNEMPLOYMENT
0.0/ 100
METRIC RATING
299th/ 347
METRIC RANK
5.5%
MALE UNEMPLOYMENT
4.9/ 100
METRIC RATING
215th/ 347
METRIC RANK
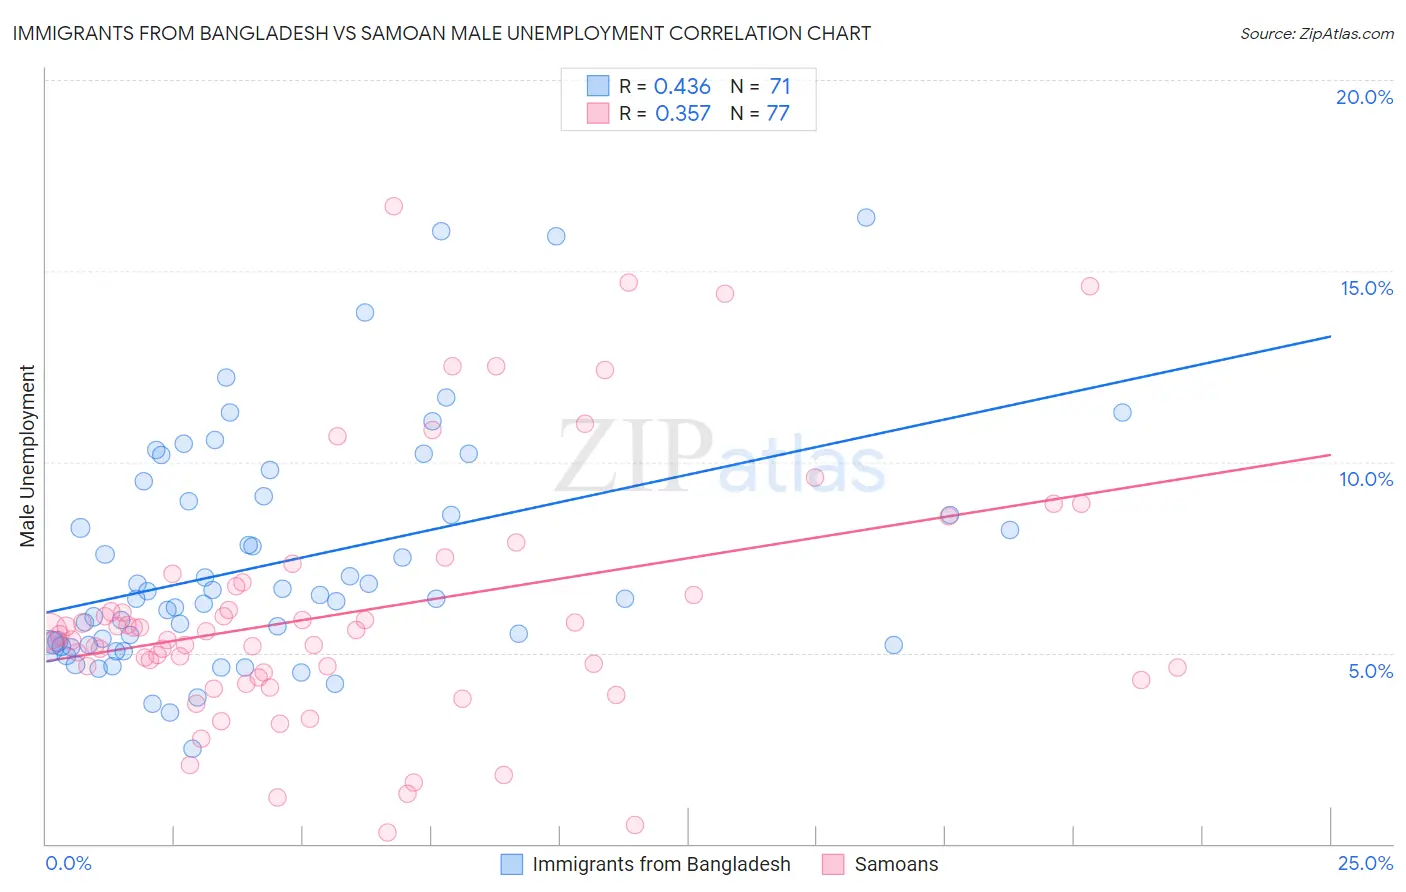
Immigrants from Bangladesh vs Samoan Male Unemployment Correlation Chart
The statistical analysis conducted on geographies consisting of 203,494,177 people shows a moderate positive correlation between the proportion of Immigrants from Bangladesh and unemployment rate among males in the United States with a correlation coefficient (R) of 0.436 and weighted average of 6.6%. Similarly, the statistical analysis conducted on geographies consisting of 224,577,965 people shows a mild positive correlation between the proportion of Samoans and unemployment rate among males in the United States with a correlation coefficient (R) of 0.357 and weighted average of 5.5%, a difference of 18.8%.
Male Unemployment Correlation Summary
| Measurement | Immigrants from Bangladesh | Samoan |
| Minimum | 2.5% | 0.30% |
| Maximum | 16.4% | 16.7% |
| Range | 13.9% | 16.4% |
| Mean | 7.4% | 6.1% |
| Median | 6.4% | 5.5% |
| Interquartile 25% (IQ1) | 5.2% | 4.4% |
| Interquartile 75% (IQ3) | 9.1% | 6.8% |
| Interquartile Range (IQR) | 3.9% | 2.4% |
| Standard Deviation (Sample) | 3.0% | 3.3% |
| Standard Deviation (Population) | 3.0% | 3.3% |
Similar Demographics by Male Unemployment
Demographics Similar to Immigrants from Bangladesh by Male Unemployment
In terms of male unemployment, the demographic groups most similar to Immigrants from Bangladesh are Jamaican (6.6%, a difference of 0.13%), Chippewa (6.6%, a difference of 0.21%), Vietnamese (6.6%, a difference of 0.27%), Immigrants from Belize (6.6%, a difference of 0.38%), and Immigrants from Haiti (6.5%, a difference of 0.53%).
| Demographics | Rating | Rank | Male Unemployment |
| Nepalese | 0.0 /100 | #292 | Tragic 6.4% |
| Haitians | 0.0 /100 | #293 | Tragic 6.4% |
| Senegalese | 0.0 /100 | #294 | Tragic 6.4% |
| Belizeans | 0.0 /100 | #295 | Tragic 6.5% |
| Immigrants | Haiti | 0.0 /100 | #296 | Tragic 6.5% |
| Chippewa | 0.0 /100 | #297 | Tragic 6.6% |
| Jamaicans | 0.0 /100 | #298 | Tragic 6.6% |
| Immigrants | Bangladesh | 0.0 /100 | #299 | Tragic 6.6% |
| Vietnamese | 0.0 /100 | #300 | Tragic 6.6% |
| Immigrants | Belize | 0.0 /100 | #301 | Tragic 6.6% |
| Ute | 0.0 /100 | #302 | Tragic 6.6% |
| Immigrants | West Indies | 0.0 /100 | #303 | Tragic 6.7% |
| West Indians | 0.0 /100 | #304 | Tragic 6.7% |
| Trinidadians and Tobagonians | 0.0 /100 | #305 | Tragic 6.7% |
| Immigrants | Trinidad and Tobago | 0.0 /100 | #306 | Tragic 6.7% |
Demographics Similar to Samoans by Male Unemployment
In terms of male unemployment, the demographic groups most similar to Samoans are Immigrants (5.5%, a difference of 0.17%), Puget Sound Salish (5.5%, a difference of 0.20%), Delaware (5.5%, a difference of 0.22%), Ugandan (5.5%, a difference of 0.37%), and Immigrants from Albania (5.5%, a difference of 0.43%).
| Demographics | Rating | Rank | Male Unemployment |
| Immigrants | Lebanon | 8.6 /100 | #208 | Tragic 5.5% |
| Immigrants | Middle Africa | 8.3 /100 | #209 | Tragic 5.5% |
| South American Indians | 7.6 /100 | #210 | Tragic 5.5% |
| Israelis | 7.4 /100 | #211 | Tragic 5.5% |
| Hmong | 7.0 /100 | #212 | Tragic 5.5% |
| Ugandans | 6.3 /100 | #213 | Tragic 5.5% |
| Puget Sound Salish | 5.6 /100 | #214 | Tragic 5.5% |
| Samoans | 4.9 /100 | #215 | Tragic 5.5% |
| Immigrants | Immigrants | 4.3 /100 | #216 | Tragic 5.5% |
| Delaware | 4.2 /100 | #217 | Tragic 5.5% |
| Immigrants | Albania | 3.6 /100 | #218 | Tragic 5.5% |
| Immigrants | Western Asia | 3.5 /100 | #219 | Tragic 5.6% |
| Portuguese | 3.5 /100 | #220 | Tragic 5.6% |
| Soviet Union | 3.2 /100 | #221 | Tragic 5.6% |
| Immigrants | Micronesia | 2.9 /100 | #222 | Tragic 5.6% |