Immigrants from Bulgaria vs Turkish Female Unemployment
COMPARE
Immigrants from Bulgaria
Turkish
Female Unemployment
Female Unemployment Comparison
Immigrants from Bulgaria
Turks
4.9%
FEMALE UNEMPLOYMENT
99.3/ 100
METRIC RATING
46th/ 347
METRIC RANK
5.0%
FEMALE UNEMPLOYMENT
97.6/ 100
METRIC RATING
79th/ 347
METRIC RANK
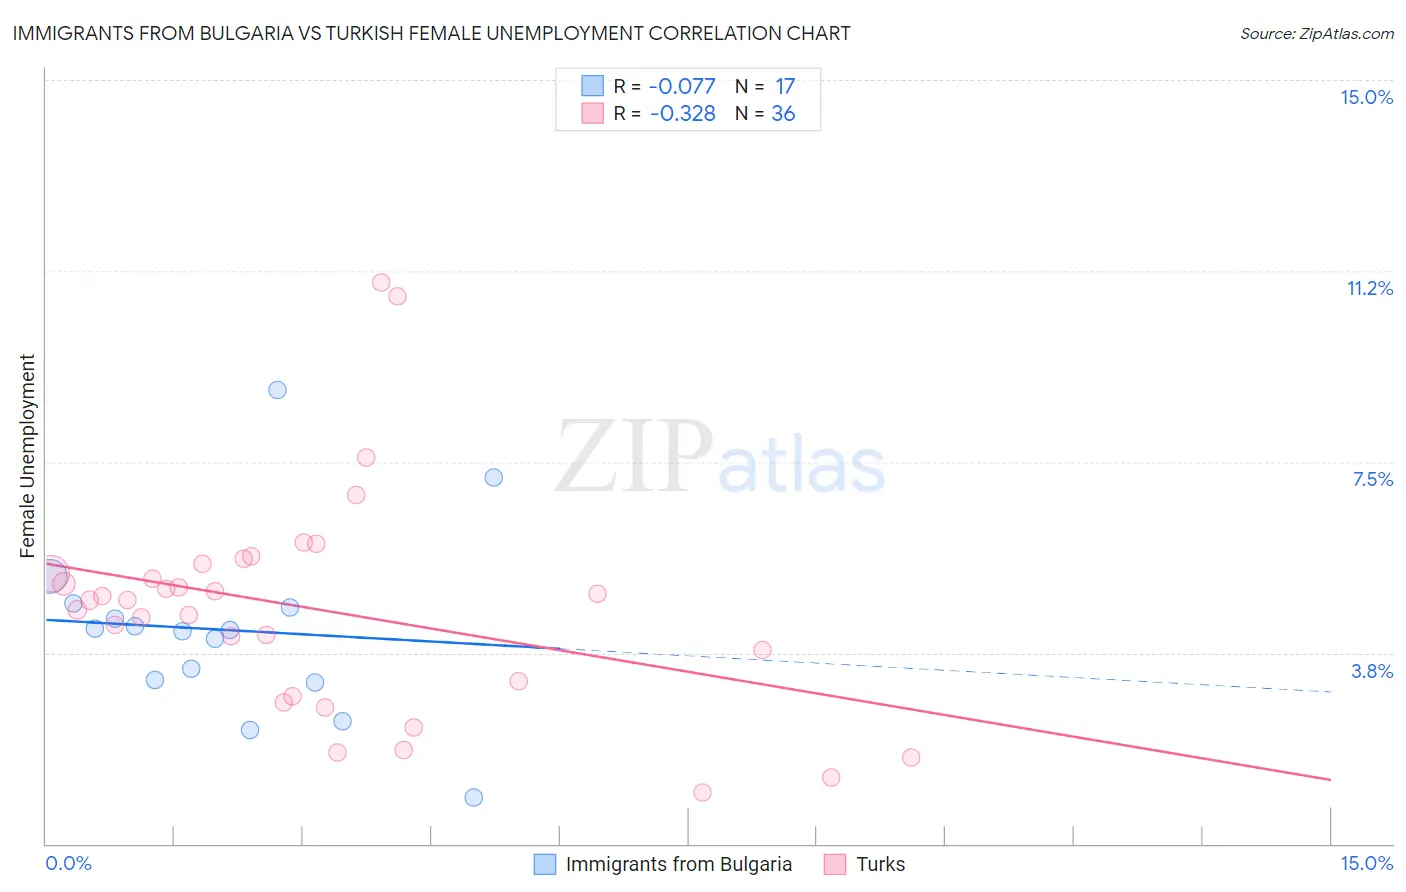
Immigrants from Bulgaria vs Turkish Female Unemployment Correlation Chart
The statistical analysis conducted on geographies consisting of 172,394,252 people shows a slight negative correlation between the proportion of Immigrants from Bulgaria and unemploymnet rate among females in the United States with a correlation coefficient (R) of -0.077 and weighted average of 4.9%. Similarly, the statistical analysis conducted on geographies consisting of 271,277,320 people shows a mild negative correlation between the proportion of Turks and unemploymnet rate among females in the United States with a correlation coefficient (R) of -0.328 and weighted average of 5.0%, a difference of 2.1%.
Female Unemployment Correlation Summary
| Measurement | Immigrants from Bulgaria | Turkish |
| Minimum | 0.90% | 1.0% |
| Maximum | 8.9% | 11.0% |
| Range | 8.0% | 10.0% |
| Mean | 4.2% | 4.6% |
| Median | 4.2% | 4.8% |
| Interquartile 25% (IQ1) | 3.2% | 3.0% |
| Interquartile 75% (IQ3) | 4.7% | 5.4% |
| Interquartile Range (IQR) | 1.5% | 2.3% |
| Standard Deviation (Sample) | 1.8% | 2.2% |
| Standard Deviation (Population) | 1.8% | 2.2% |
Similar Demographics by Female Unemployment
Demographics Similar to Immigrants from Bulgaria by Female Unemployment
In terms of female unemployment, the demographic groups most similar to Immigrants from Bulgaria are Austrian (4.9%, a difference of 0.030%), Okinawan (4.9%, a difference of 0.080%), Greek (4.9%, a difference of 0.10%), Eastern European (4.9%, a difference of 0.21%), and Thai (4.9%, a difference of 0.29%).
| Demographics | Rating | Rank | Female Unemployment |
| Scotch-Irish | 99.6 /100 | #39 | Exceptional 4.8% |
| French | 99.6 /100 | #40 | Exceptional 4.8% |
| Tongans | 99.5 /100 | #41 | Exceptional 4.8% |
| Italians | 99.5 /100 | #42 | Exceptional 4.8% |
| Eastern Europeans | 99.4 /100 | #43 | Exceptional 4.9% |
| Greeks | 99.4 /100 | #44 | Exceptional 4.9% |
| Austrians | 99.3 /100 | #45 | Exceptional 4.9% |
| Immigrants | Bulgaria | 99.3 /100 | #46 | Exceptional 4.9% |
| Okinawans | 99.3 /100 | #47 | Exceptional 4.9% |
| Thais | 99.2 /100 | #48 | Exceptional 4.9% |
| Australians | 99.2 /100 | #49 | Exceptional 4.9% |
| Immigrants | Cuba | 99.1 /100 | #50 | Exceptional 4.9% |
| Cambodians | 99.1 /100 | #51 | Exceptional 4.9% |
| Slavs | 99.1 /100 | #52 | Exceptional 4.9% |
| Whites/Caucasians | 99.0 /100 | #53 | Exceptional 4.9% |
Demographics Similar to Turks by Female Unemployment
In terms of female unemployment, the demographic groups most similar to Turks are New Zealander (5.0%, a difference of 0.12%), Filipino (5.0%, a difference of 0.14%), Immigrants from Netherlands (5.0%, a difference of 0.18%), Mongolian (5.0%, a difference of 0.19%), and Immigrants from Australia (5.0%, a difference of 0.19%).
| Demographics | Rating | Rank | Female Unemployment |
| Immigrants | Northern Europe | 98.0 /100 | #72 | Exceptional 4.9% |
| Russians | 98.0 /100 | #73 | Exceptional 5.0% |
| Immigrants | Bolivia | 98.0 /100 | #74 | Exceptional 5.0% |
| Immigrants | Singapore | 98.0 /100 | #75 | Exceptional 5.0% |
| Immigrants | Venezuela | 97.9 /100 | #76 | Exceptional 5.0% |
| Mongolians | 97.8 /100 | #77 | Exceptional 5.0% |
| Immigrants | Netherlands | 97.8 /100 | #78 | Exceptional 5.0% |
| Turks | 97.6 /100 | #79 | Exceptional 5.0% |
| New Zealanders | 97.4 /100 | #80 | Exceptional 5.0% |
| Filipinos | 97.3 /100 | #81 | Exceptional 5.0% |
| Immigrants | Australia | 97.3 /100 | #82 | Exceptional 5.0% |
| Immigrants | Serbia | 97.2 /100 | #83 | Exceptional 5.0% |
| Canadians | 97.2 /100 | #84 | Exceptional 5.0% |
| Ukrainians | 97.1 /100 | #85 | Exceptional 5.0% |
| Bolivians | 97.1 /100 | #86 | Exceptional 5.0% |