Irish vs Vietnamese Unemployment Among Ages 55 to 59 years
COMPARE
Irish
Vietnamese
Unemployment Among Ages 55 to 59 years
Unemployment Among Ages 55 to 59 years Comparison
Irish
Vietnamese
4.7%
UNEMPLOYMENT AMONG AGES 55 TO 59 YEARS
96.8/ 100
METRIC RATING
89th/ 347
METRIC RANK
5.9%
UNEMPLOYMENT AMONG AGES 55 TO 59 YEARS
0.0/ 100
METRIC RATING
324th/ 347
METRIC RANK
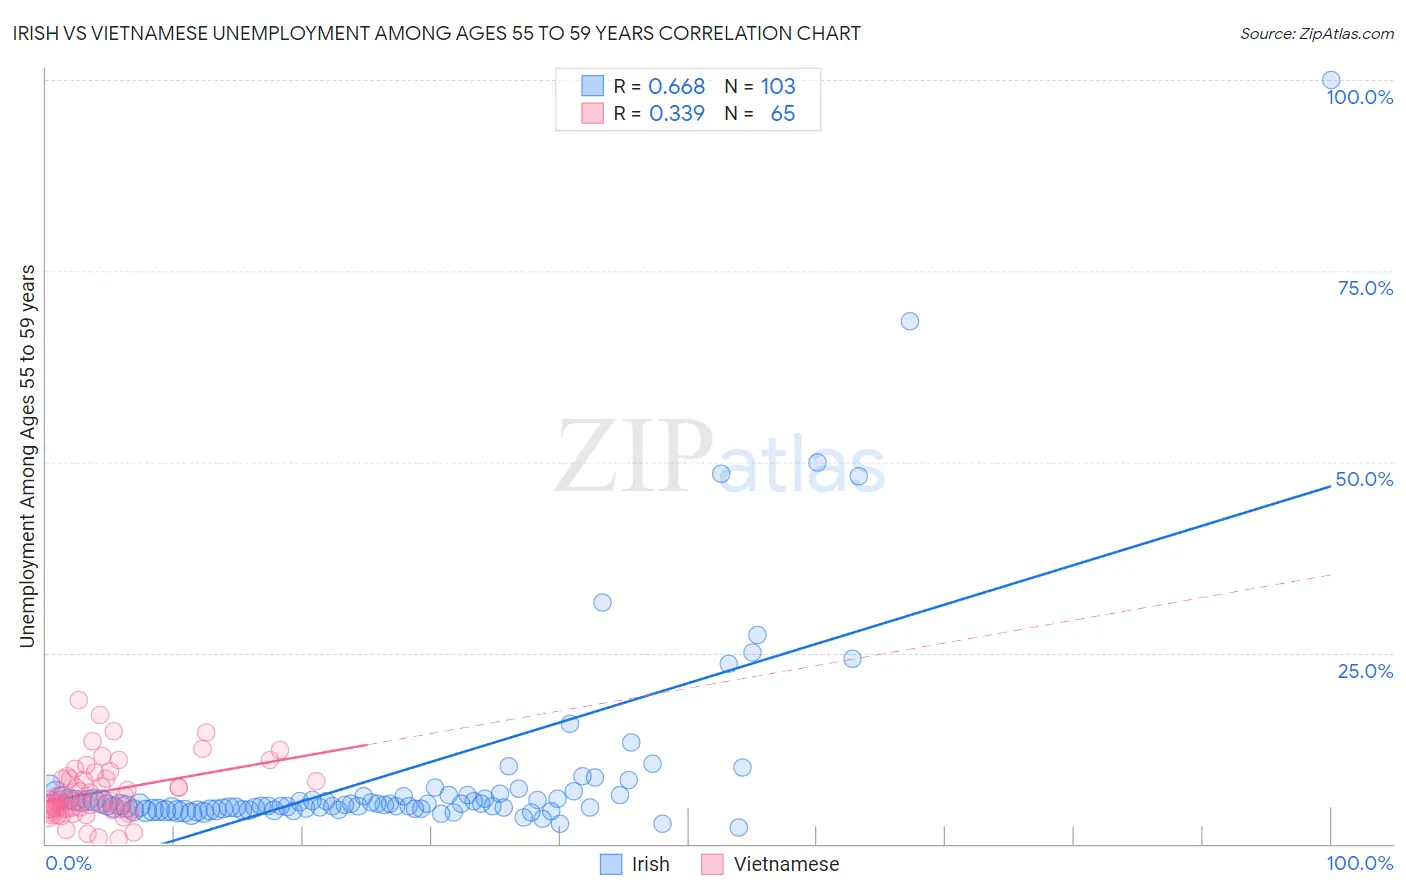
Irish vs Vietnamese Unemployment Among Ages 55 to 59 years Correlation Chart
The statistical analysis conducted on geographies consisting of 489,494,475 people shows a significant positive correlation between the proportion of Irish and unemployment rate among population between the ages 55 and 59 in the United States with a correlation coefficient (R) of 0.668 and weighted average of 4.7%. Similarly, the statistical analysis conducted on geographies consisting of 165,879,881 people shows a mild positive correlation between the proportion of Vietnamese and unemployment rate among population between the ages 55 and 59 in the United States with a correlation coefficient (R) of 0.339 and weighted average of 5.9%, a difference of 26.4%.
Unemployment Among Ages 55 to 59 years Correlation Summary
| Measurement | Irish | Vietnamese |
| Minimum | 2.2% | 0.70% |
| Maximum | 100.0% | 18.8% |
| Range | 97.8% | 18.1% |
| Mean | 9.3% | 6.8% |
| Median | 5.1% | 5.7% |
| Interquartile 25% (IQ1) | 4.5% | 4.5% |
| Interquartile 75% (IQ3) | 6.3% | 8.6% |
| Interquartile Range (IQR) | 1.9% | 4.0% |
| Standard Deviation (Sample) | 13.9% | 3.7% |
| Standard Deviation (Population) | 13.8% | 3.7% |
Similar Demographics by Unemployment Among Ages 55 to 59 years
Demographics Similar to Irish by Unemployment Among Ages 55 to 59 years
In terms of unemployment among ages 55 to 59 years, the demographic groups most similar to Irish are Polish (4.7%, a difference of 0.020%), Immigrants from Cameroon (4.7%, a difference of 0.020%), Immigrants from Colombia (4.7%, a difference of 0.040%), Malaysian (4.7%, a difference of 0.050%), and Immigrants from Vietnam (4.7%, a difference of 0.050%).
| Demographics | Rating | Rank | Unemployment Among Ages 55 to 59 years |
| Latvians | 97.8 /100 | #82 | Exceptional 4.6% |
| Lebanese | 97.5 /100 | #83 | Exceptional 4.6% |
| Malaysians | 96.9 /100 | #84 | Exceptional 4.7% |
| Immigrants | Vietnam | 96.9 /100 | #85 | Exceptional 4.7% |
| Immigrants | Colombia | 96.9 /100 | #86 | Exceptional 4.7% |
| Poles | 96.9 /100 | #87 | Exceptional 4.7% |
| Immigrants | Cameroon | 96.9 /100 | #88 | Exceptional 4.7% |
| Irish | 96.8 /100 | #89 | Exceptional 4.7% |
| Immigrants | Poland | 96.4 /100 | #90 | Exceptional 4.7% |
| New Zealanders | 96.3 /100 | #91 | Exceptional 4.7% |
| Iraqis | 96.1 /100 | #92 | Exceptional 4.7% |
| Immigrants | England | 95.8 /100 | #93 | Exceptional 4.7% |
| Immigrants | Scotland | 95.7 /100 | #94 | Exceptional 4.7% |
| South Africans | 95.6 /100 | #95 | Exceptional 4.7% |
| Immigrants | Belgium | 95.0 /100 | #96 | Exceptional 4.7% |
Demographics Similar to Vietnamese by Unemployment Among Ages 55 to 59 years
In terms of unemployment among ages 55 to 59 years, the demographic groups most similar to Vietnamese are Immigrants from Bangladesh (5.9%, a difference of 0.070%), Crow (5.9%, a difference of 0.080%), Chippewa (5.9%, a difference of 0.14%), Immigrants from Armenia (6.0%, a difference of 1.8%), and Immigrants from the Azores (5.8%, a difference of 2.0%).
| Demographics | Rating | Rank | Unemployment Among Ages 55 to 59 years |
| Hmong | 0.0 /100 | #317 | Tragic 5.7% |
| Immigrants | Guyana | 0.0 /100 | #318 | Tragic 5.8% |
| Kiowa | 0.0 /100 | #319 | Tragic 5.8% |
| Immigrants | Azores | 0.0 /100 | #320 | Tragic 5.8% |
| Chippewa | 0.0 /100 | #321 | Tragic 5.9% |
| Crow | 0.0 /100 | #322 | Tragic 5.9% |
| Immigrants | Bangladesh | 0.0 /100 | #323 | Tragic 5.9% |
| Vietnamese | 0.0 /100 | #324 | Tragic 5.9% |
| Immigrants | Armenia | 0.0 /100 | #325 | Tragic 6.0% |
| Natives/Alaskans | 0.0 /100 | #326 | Tragic 6.0% |
| Arapaho | 0.0 /100 | #327 | Tragic 6.1% |
| Yuman | 0.0 /100 | #328 | Tragic 6.1% |
| Dominicans | 0.0 /100 | #329 | Tragic 6.2% |
| Alaska Natives | 0.0 /100 | #330 | Tragic 6.2% |
| Immigrants | Dominican Republic | 0.0 /100 | #331 | Tragic 6.3% |