Osage vs Immigrants from Latvia Unemployment Among Ages 55 to 59 years
COMPARE
Osage
Immigrants from Latvia
Unemployment Among Ages 55 to 59 years
Unemployment Among Ages 55 to 59 years Comparison
Osage
Immigrants from Latvia
4.8%
UNEMPLOYMENT AMONG AGES 55 TO 59 YEARS
37.0/ 100
METRIC RATING
186th/ 347
METRIC RANK
4.9%
UNEMPLOYMENT AMONG AGES 55 TO 59 YEARS
18.5/ 100
METRIC RATING
204th/ 347
METRIC RANK
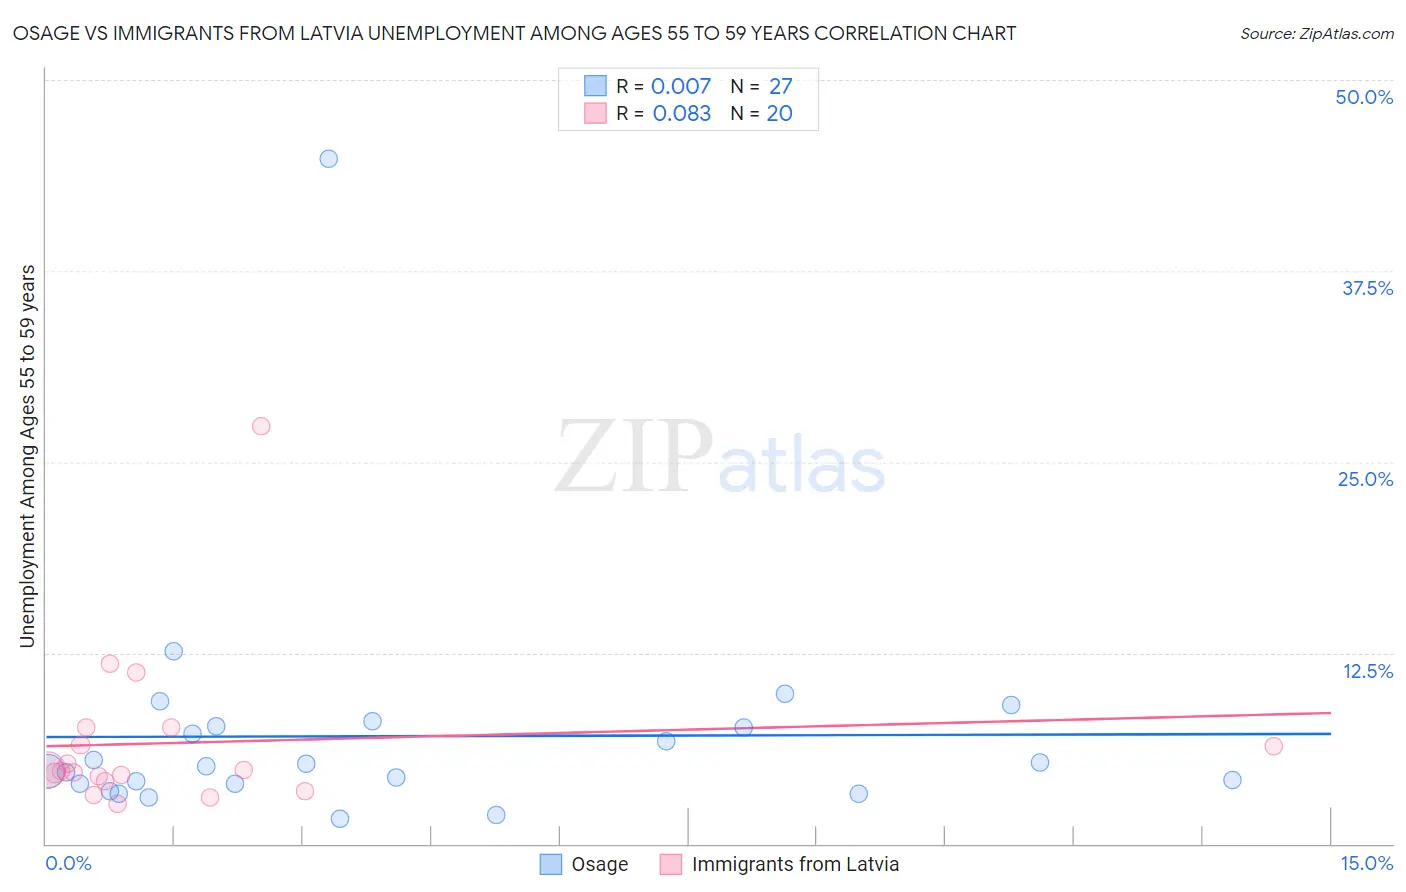
Osage vs Immigrants from Latvia Unemployment Among Ages 55 to 59 years Correlation Chart
The statistical analysis conducted on geographies consisting of 89,169,253 people shows no correlation between the proportion of Osage and unemployment rate among population between the ages 55 and 59 in the United States with a correlation coefficient (R) of 0.007 and weighted average of 4.8%. Similarly, the statistical analysis conducted on geographies consisting of 111,271,866 people shows a slight positive correlation between the proportion of Immigrants from Latvia and unemployment rate among population between the ages 55 and 59 in the United States with a correlation coefficient (R) of 0.083 and weighted average of 4.9%, a difference of 0.97%.
Unemployment Among Ages 55 to 59 years Correlation Summary
| Measurement | Osage | Immigrants from Latvia |
| Minimum | 1.6% | 2.6% |
| Maximum | 44.8% | 27.3% |
| Range | 43.2% | 24.7% |
| Mean | 7.0% | 6.6% |
| Median | 5.1% | 4.8% |
| Interquartile 25% (IQ1) | 3.9% | 4.2% |
| Interquartile 75% (IQ3) | 7.7% | 7.0% |
| Interquartile Range (IQR) | 3.8% | 2.8% |
| Standard Deviation (Sample) | 8.0% | 5.5% |
| Standard Deviation (Population) | 7.8% | 5.3% |
Demographics Similar to Osage and Immigrants from Latvia by Unemployment Among Ages 55 to 59 years
In terms of unemployment among ages 55 to 59 years, the demographic groups most similar to Osage are Peruvian (4.8%, a difference of 0.0%), Immigrants from Morocco (4.8%, a difference of 0.020%), Immigrants from Eastern Asia (4.8%, a difference of 0.040%), Iroquois (4.9%, a difference of 0.11%), and Russian (4.9%, a difference of 0.14%). Similarly, the demographic groups most similar to Immigrants from Latvia are Haitian (4.9%, a difference of 0.020%), Guamanian/Chamorro (4.9%, a difference of 0.15%), Lumbee (4.9%, a difference of 0.25%), Immigrants from South America (4.9%, a difference of 0.28%), and Basque (4.9%, a difference of 0.30%).
| Demographics | Rating | Rank | Unemployment Among Ages 55 to 59 years |
| Peruvians | 37.0 /100 | #185 | Fair 4.8% |
| Osage | 37.0 /100 | #186 | Fair 4.8% |
| Immigrants | Morocco | 36.5 /100 | #187 | Fair 4.8% |
| Immigrants | Eastern Asia | 36.1 /100 | #188 | Fair 4.8% |
| Iroquois | 34.5 /100 | #189 | Fair 4.9% |
| Russians | 33.9 /100 | #190 | Fair 4.9% |
| Iranians | 32.4 /100 | #191 | Fair 4.9% |
| Immigrants | Ukraine | 31.7 /100 | #192 | Fair 4.9% |
| Immigrants | Italy | 30.1 /100 | #193 | Fair 4.9% |
| Spaniards | 27.2 /100 | #194 | Fair 4.9% |
| Estonians | 27.2 /100 | #195 | Fair 4.9% |
| Eastern Europeans | 26.7 /100 | #196 | Fair 4.9% |
| Macedonians | 26.4 /100 | #197 | Fair 4.9% |
| Immigrants | Philippines | 26.1 /100 | #198 | Fair 4.9% |
| Immigrants | Russia | 23.7 /100 | #199 | Fair 4.9% |
| Basques | 23.3 /100 | #200 | Fair 4.9% |
| Immigrants | South America | 23.1 /100 | #201 | Fair 4.9% |
| Lumbee | 22.5 /100 | #202 | Fair 4.9% |
| Guamanians/Chamorros | 20.8 /100 | #203 | Fair 4.9% |
| Immigrants | Latvia | 18.5 /100 | #204 | Poor 4.9% |
| Haitians | 18.1 /100 | #205 | Poor 4.9% |