Immigrants from Argentina vs Czechoslovakian Female Unemployment
COMPARE
Immigrants from Argentina
Czechoslovakian
Female Unemployment
Female Unemployment Comparison
Immigrants from Argentina
Czechoslovakians
5.2%
FEMALE UNEMPLOYMENT
78.7/ 100
METRIC RATING
148th/ 347
METRIC RANK
4.8%
FEMALE UNEMPLOYMENT
99.7/ 100
METRIC RATING
33rd/ 347
METRIC RANK
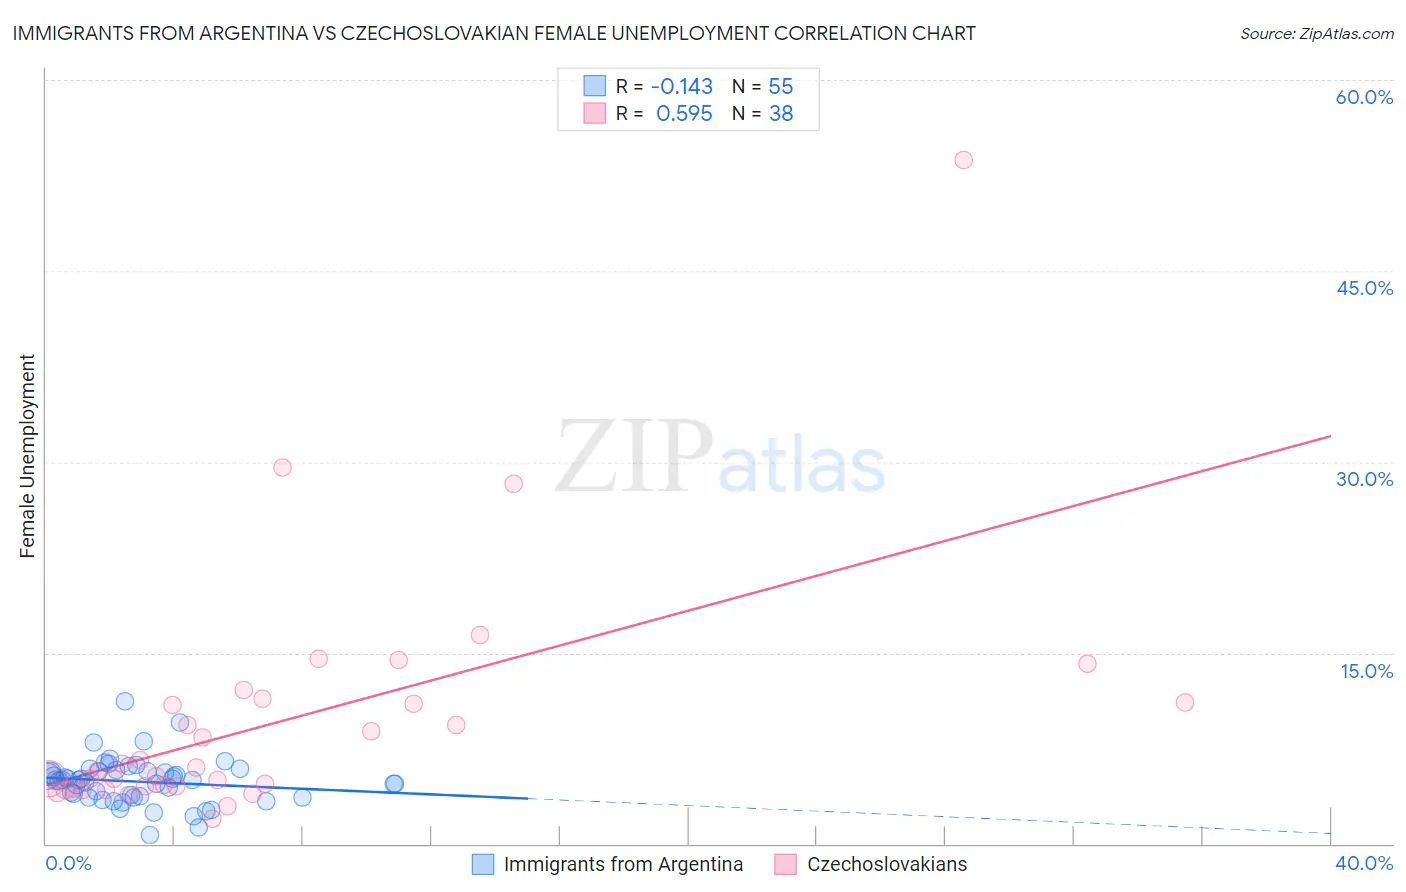
Immigrants from Argentina vs Czechoslovakian Female Unemployment Correlation Chart
The statistical analysis conducted on geographies consisting of 263,999,591 people shows a poor negative correlation between the proportion of Immigrants from Argentina and unemploymnet rate among females in the United States with a correlation coefficient (R) of -0.143 and weighted average of 5.2%. Similarly, the statistical analysis conducted on geographies consisting of 365,958,591 people shows a substantial positive correlation between the proportion of Czechoslovakians and unemploymnet rate among females in the United States with a correlation coefficient (R) of 0.595 and weighted average of 4.8%, a difference of 7.6%.
Female Unemployment Correlation Summary
| Measurement | Immigrants from Argentina | Czechoslovakian |
| Minimum | 0.70% | 1.9% |
| Maximum | 11.2% | 53.7% |
| Range | 10.5% | 51.8% |
| Mean | 4.9% | 9.6% |
| Median | 5.0% | 5.8% |
| Interquartile 25% (IQ1) | 3.7% | 4.5% |
| Interquartile 75% (IQ3) | 5.7% | 11.1% |
| Interquartile Range (IQR) | 2.1% | 6.6% |
| Standard Deviation (Sample) | 1.8% | 9.6% |
| Standard Deviation (Population) | 1.8% | 9.4% |
Similar Demographics by Female Unemployment
Demographics Similar to Immigrants from Argentina by Female Unemployment
In terms of female unemployment, the demographic groups most similar to Immigrants from Argentina are Asian (5.2%, a difference of 0.030%), Egyptian (5.2%, a difference of 0.040%), Argentinean (5.2%, a difference of 0.050%), Immigrants from Norway (5.2%, a difference of 0.060%), and Immigrants from Oceania (5.2%, a difference of 0.070%).
| Demographics | Rating | Rank | Female Unemployment |
| Immigrants | Eastern Europe | 81.5 /100 | #141 | Excellent 5.1% |
| Palestinians | 80.8 /100 | #142 | Excellent 5.1% |
| Immigrants | Kazakhstan | 80.7 /100 | #143 | Excellent 5.1% |
| Immigrants | Jordan | 80.4 /100 | #144 | Excellent 5.1% |
| Immigrants | Oceania | 79.5 /100 | #145 | Good 5.2% |
| Immigrants | Norway | 79.4 /100 | #146 | Good 5.2% |
| Argentineans | 79.2 /100 | #147 | Good 5.2% |
| Immigrants | Argentina | 78.7 /100 | #148 | Good 5.2% |
| Asians | 78.3 /100 | #149 | Good 5.2% |
| Egyptians | 78.3 /100 | #150 | Good 5.2% |
| Immigrants | China | 75.9 /100 | #151 | Good 5.2% |
| Immigrants | Italy | 75.0 /100 | #152 | Good 5.2% |
| Immigrants | Greece | 74.9 /100 | #153 | Good 5.2% |
| South Africans | 70.8 /100 | #154 | Good 5.2% |
| Immigrants | Egypt | 70.0 /100 | #155 | Good 5.2% |
Demographics Similar to Czechoslovakians by Female Unemployment
In terms of female unemployment, the demographic groups most similar to Czechoslovakians are Zimbabwean (4.8%, a difference of 0.030%), French Canadian (4.8%, a difference of 0.10%), Yugoslavian (4.8%, a difference of 0.24%), Slovak (4.8%, a difference of 0.51%), and Pennsylvania German (4.8%, a difference of 0.61%).
| Demographics | Rating | Rank | Female Unemployment |
| Immigrants | Bosnia and Herzegovina | 99.9 /100 | #26 | Exceptional 4.7% |
| British | 99.9 /100 | #27 | Exceptional 4.7% |
| Irish | 99.9 /100 | #28 | Exceptional 4.7% |
| Cypriots | 99.9 /100 | #29 | Exceptional 4.7% |
| Lithuanians | 99.8 /100 | #30 | Exceptional 4.7% |
| Sudanese | 99.8 /100 | #31 | Exceptional 4.8% |
| Slovaks | 99.8 /100 | #32 | Exceptional 4.8% |
| Czechoslovakians | 99.7 /100 | #33 | Exceptional 4.8% |
| Zimbabweans | 99.7 /100 | #34 | Exceptional 4.8% |
| French Canadians | 99.7 /100 | #35 | Exceptional 4.8% |
| Yugoslavians | 99.7 /100 | #36 | Exceptional 4.8% |
| Pennsylvania Germans | 99.6 /100 | #37 | Exceptional 4.8% |
| Northern Europeans | 99.6 /100 | #38 | Exceptional 4.8% |
| Scotch-Irish | 99.6 /100 | #39 | Exceptional 4.8% |
| French | 99.6 /100 | #40 | Exceptional 4.8% |