Immigrants from Belize vs Immigrants from Afghanistan Male Unemployment
COMPARE
Immigrants from Belize
Immigrants from Afghanistan
Male Unemployment
Male Unemployment Comparison
Immigrants from Belize
Immigrants from Afghanistan
6.6%
MALE UNEMPLOYMENT
0.0/ 100
METRIC RATING
301st/ 347
METRIC RANK
5.3%
MALE UNEMPLOYMENT
37.9/ 100
METRIC RATING
181st/ 347
METRIC RANK
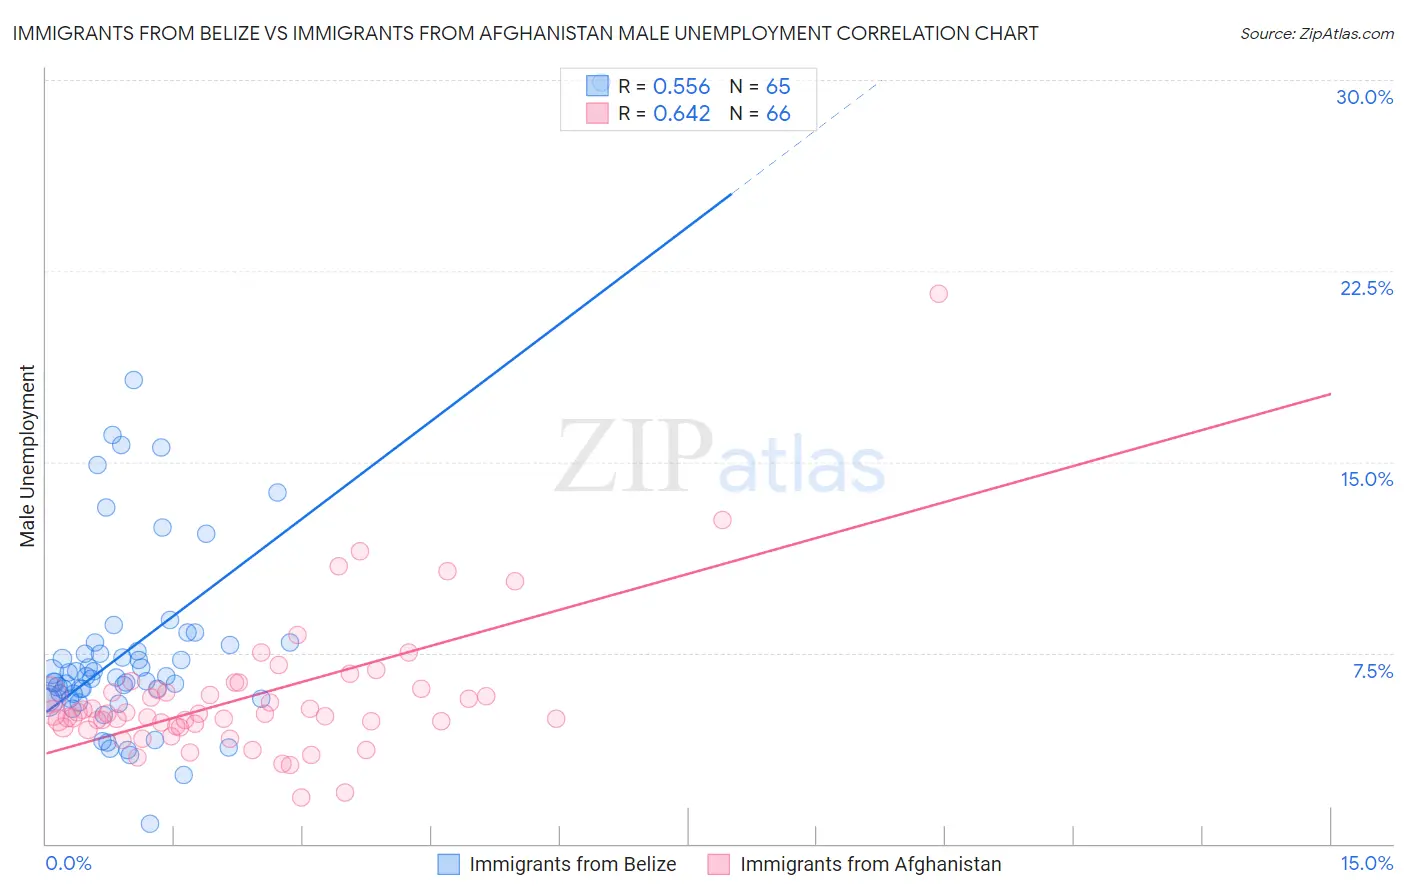
Immigrants from Belize vs Immigrants from Afghanistan Male Unemployment Correlation Chart
The statistical analysis conducted on geographies consisting of 130,217,625 people shows a substantial positive correlation between the proportion of Immigrants from Belize and unemployment rate among males in the United States with a correlation coefficient (R) of 0.556 and weighted average of 6.6%. Similarly, the statistical analysis conducted on geographies consisting of 147,586,191 people shows a significant positive correlation between the proportion of Immigrants from Afghanistan and unemployment rate among males in the United States with a correlation coefficient (R) of 0.642 and weighted average of 5.3%, a difference of 23.6%.
Male Unemployment Correlation Summary
| Measurement | Immigrants from Belize | Immigrants from Afghanistan |
| Minimum | 0.80% | 1.8% |
| Maximum | 29.9% | 21.6% |
| Range | 29.1% | 19.8% |
| Mean | 7.7% | 5.8% |
| Median | 6.5% | 5.1% |
| Interquartile 25% (IQ1) | 5.7% | 4.6% |
| Interquartile 75% (IQ3) | 7.9% | 6.0% |
| Interquartile Range (IQR) | 2.1% | 1.4% |
| Standard Deviation (Sample) | 4.4% | 2.8% |
| Standard Deviation (Population) | 4.3% | 2.8% |
Similar Demographics by Male Unemployment
Demographics Similar to Immigrants from Belize by Male Unemployment
In terms of male unemployment, the demographic groups most similar to Immigrants from Belize are Vietnamese (6.6%, a difference of 0.11%), Immigrants from Bangladesh (6.6%, a difference of 0.38%), Jamaican (6.6%, a difference of 0.51%), Chippewa (6.6%, a difference of 0.58%), and Ute (6.6%, a difference of 0.71%).
| Demographics | Rating | Rank | Male Unemployment |
| Senegalese | 0.0 /100 | #294 | Tragic 6.4% |
| Belizeans | 0.0 /100 | #295 | Tragic 6.5% |
| Immigrants | Haiti | 0.0 /100 | #296 | Tragic 6.5% |
| Chippewa | 0.0 /100 | #297 | Tragic 6.6% |
| Jamaicans | 0.0 /100 | #298 | Tragic 6.6% |
| Immigrants | Bangladesh | 0.0 /100 | #299 | Tragic 6.6% |
| Vietnamese | 0.0 /100 | #300 | Tragic 6.6% |
| Immigrants | Belize | 0.0 /100 | #301 | Tragic 6.6% |
| Ute | 0.0 /100 | #302 | Tragic 6.6% |
| Immigrants | West Indies | 0.0 /100 | #303 | Tragic 6.7% |
| West Indians | 0.0 /100 | #304 | Tragic 6.7% |
| Trinidadians and Tobagonians | 0.0 /100 | #305 | Tragic 6.7% |
| Immigrants | Trinidad and Tobago | 0.0 /100 | #306 | Tragic 6.7% |
| Immigrants | Jamaica | 0.0 /100 | #307 | Tragic 6.7% |
| Aleuts | 0.0 /100 | #308 | Tragic 6.8% |
Demographics Similar to Immigrants from Afghanistan by Male Unemployment
In terms of male unemployment, the demographic groups most similar to Immigrants from Afghanistan are Potawatomi (5.3%, a difference of 0.010%), Taiwanese (5.3%, a difference of 0.020%), Malaysian (5.3%, a difference of 0.10%), Immigrants from Oceania (5.3%, a difference of 0.18%), and Spaniard (5.3%, a difference of 0.18%).
| Demographics | Rating | Rank | Male Unemployment |
| Immigrants | Iran | 50.0 /100 | #174 | Average 5.3% |
| Immigrants | Iraq | 48.1 /100 | #175 | Average 5.3% |
| Immigrants | Poland | 46.0 /100 | #176 | Average 5.3% |
| Immigrants | Peru | 44.6 /100 | #177 | Average 5.3% |
| Osage | 42.5 /100 | #178 | Average 5.3% |
| Immigrants | Oceania | 40.8 /100 | #179 | Average 5.3% |
| Malaysians | 39.6 /100 | #180 | Fair 5.3% |
| Immigrants | Afghanistan | 37.9 /100 | #181 | Fair 5.3% |
| Potawatomi | 37.8 /100 | #182 | Fair 5.3% |
| Taiwanese | 37.6 /100 | #183 | Fair 5.3% |
| Spaniards | 35.1 /100 | #184 | Fair 5.3% |
| Koreans | 34.9 /100 | #185 | Fair 5.3% |
| Iraqis | 31.6 /100 | #186 | Fair 5.4% |
| Costa Ricans | 31.3 /100 | #187 | Fair 5.4% |
| Arabs | 30.2 /100 | #188 | Fair 5.4% |