Immigrants from Belize vs Iroquois Male Unemployment
COMPARE
Immigrants from Belize
Iroquois
Male Unemployment
Male Unemployment Comparison
Immigrants from Belize
Iroquois
6.6%
MALE UNEMPLOYMENT
0.0/ 100
METRIC RATING
301st/ 347
METRIC RANK
5.7%
MALE UNEMPLOYMENT
0.6/ 100
METRIC RATING
246th/ 347
METRIC RANK
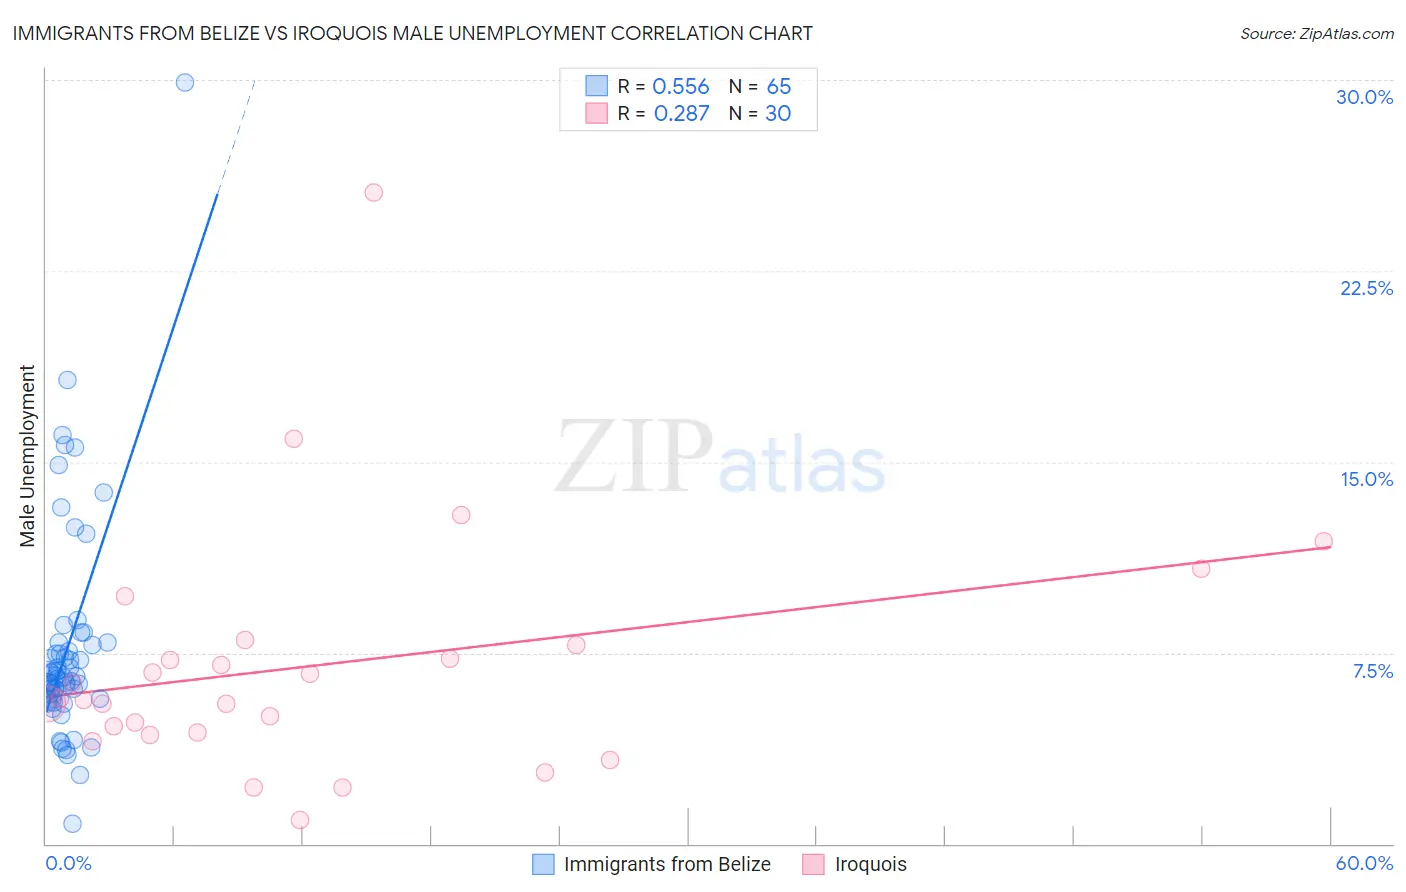
Immigrants from Belize vs Iroquois Male Unemployment Correlation Chart
The statistical analysis conducted on geographies consisting of 130,217,625 people shows a substantial positive correlation between the proportion of Immigrants from Belize and unemployment rate among males in the United States with a correlation coefficient (R) of 0.556 and weighted average of 6.6%. Similarly, the statistical analysis conducted on geographies consisting of 206,667,953 people shows a weak positive correlation between the proportion of Iroquois and unemployment rate among males in the United States with a correlation coefficient (R) of 0.287 and weighted average of 5.7%, a difference of 15.9%.
Male Unemployment Correlation Summary
| Measurement | Immigrants from Belize | Iroquois |
| Minimum | 0.80% | 0.95% |
| Maximum | 29.9% | 25.6% |
| Range | 29.1% | 24.6% |
| Mean | 7.7% | 7.0% |
| Median | 6.5% | 5.7% |
| Interquartile 25% (IQ1) | 5.7% | 4.4% |
| Interquartile 75% (IQ3) | 7.9% | 7.8% |
| Interquartile Range (IQR) | 2.1% | 3.4% |
| Standard Deviation (Sample) | 4.4% | 4.8% |
| Standard Deviation (Population) | 4.3% | 4.7% |
Similar Demographics by Male Unemployment
Demographics Similar to Immigrants from Belize by Male Unemployment
In terms of male unemployment, the demographic groups most similar to Immigrants from Belize are Vietnamese (6.6%, a difference of 0.11%), Immigrants from Bangladesh (6.6%, a difference of 0.38%), Jamaican (6.6%, a difference of 0.51%), Chippewa (6.6%, a difference of 0.58%), and Ute (6.6%, a difference of 0.71%).
| Demographics | Rating | Rank | Male Unemployment |
| Senegalese | 0.0 /100 | #294 | Tragic 6.4% |
| Belizeans | 0.0 /100 | #295 | Tragic 6.5% |
| Immigrants | Haiti | 0.0 /100 | #296 | Tragic 6.5% |
| Chippewa | 0.0 /100 | #297 | Tragic 6.6% |
| Jamaicans | 0.0 /100 | #298 | Tragic 6.6% |
| Immigrants | Bangladesh | 0.0 /100 | #299 | Tragic 6.6% |
| Vietnamese | 0.0 /100 | #300 | Tragic 6.6% |
| Immigrants | Belize | 0.0 /100 | #301 | Tragic 6.6% |
| Ute | 0.0 /100 | #302 | Tragic 6.6% |
| Immigrants | West Indies | 0.0 /100 | #303 | Tragic 6.7% |
| West Indians | 0.0 /100 | #304 | Tragic 6.7% |
| Trinidadians and Tobagonians | 0.0 /100 | #305 | Tragic 6.7% |
| Immigrants | Trinidad and Tobago | 0.0 /100 | #306 | Tragic 6.7% |
| Immigrants | Jamaica | 0.0 /100 | #307 | Tragic 6.7% |
| Aleuts | 0.0 /100 | #308 | Tragic 6.8% |
Demographics Similar to Iroquois by Male Unemployment
In terms of male unemployment, the demographic groups most similar to Iroquois are Yaqui (5.7%, a difference of 0.090%), Hawaiian (5.7%, a difference of 0.10%), Immigrants from El Salvador (5.7%, a difference of 0.26%), Bangladeshi (5.7%, a difference of 0.30%), and Marshallese (5.7%, a difference of 0.41%).
| Demographics | Rating | Rank | Male Unemployment |
| Immigrants | Guatemala | 1.1 /100 | #239 | Tragic 5.6% |
| Immigrants | Cameroon | 1.0 /100 | #240 | Tragic 5.6% |
| Salvadorans | 1.0 /100 | #241 | Tragic 5.7% |
| Ottawa | 0.9 /100 | #242 | Tragic 5.7% |
| Bangladeshis | 0.8 /100 | #243 | Tragic 5.7% |
| Immigrants | El Salvador | 0.7 /100 | #244 | Tragic 5.7% |
| Yaqui | 0.7 /100 | #245 | Tragic 5.7% |
| Iroquois | 0.6 /100 | #246 | Tragic 5.7% |
| Hawaiians | 0.6 /100 | #247 | Tragic 5.7% |
| Marshallese | 0.5 /100 | #248 | Tragic 5.7% |
| Cree | 0.4 /100 | #249 | Tragic 5.7% |
| Immigrants | Bahamas | 0.4 /100 | #250 | Tragic 5.7% |
| Spanish Americans | 0.3 /100 | #251 | Tragic 5.7% |
| Mexicans | 0.2 /100 | #252 | Tragic 5.8% |
| Mexican American Indians | 0.2 /100 | #253 | Tragic 5.8% |