Immigrants from Belarus vs Alaska Native Male Unemployment
COMPARE
Immigrants from Belarus
Alaska Native
Male Unemployment
Male Unemployment Comparison
Immigrants from Belarus
Alaska Natives
5.4%
MALE UNEMPLOYMENT
26.0/ 100
METRIC RATING
192nd/ 347
METRIC RANK
8.1%
MALE UNEMPLOYMENT
0.0/ 100
METRIC RATING
331st/ 347
METRIC RANK
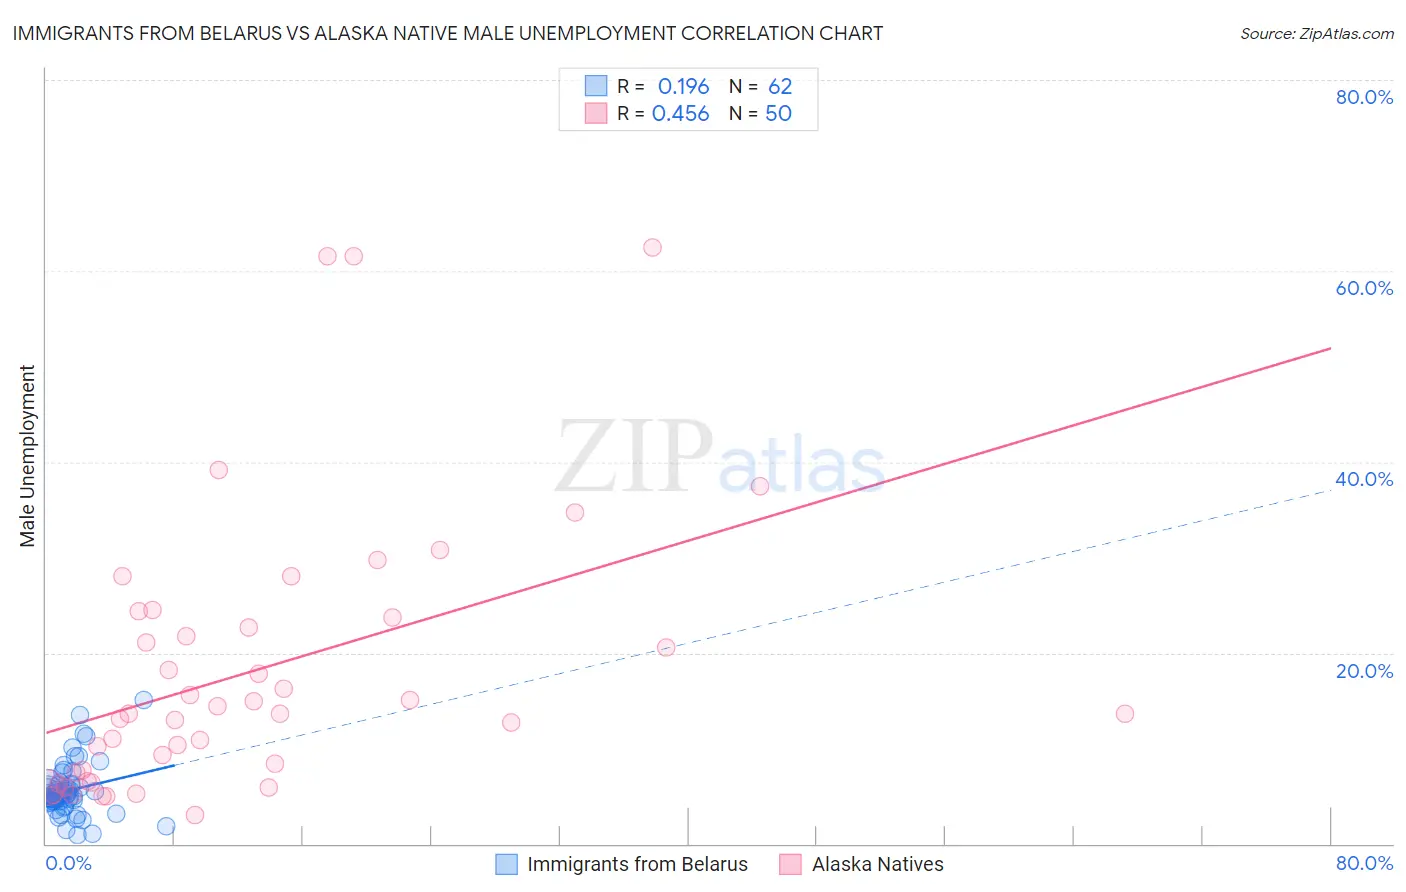
Immigrants from Belarus vs Alaska Native Male Unemployment Correlation Chart
The statistical analysis conducted on geographies consisting of 150,060,028 people shows a poor positive correlation between the proportion of Immigrants from Belarus and unemployment rate among males in the United States with a correlation coefficient (R) of 0.196 and weighted average of 5.4%. Similarly, the statistical analysis conducted on geographies consisting of 76,676,462 people shows a moderate positive correlation between the proportion of Alaska Natives and unemployment rate among males in the United States with a correlation coefficient (R) of 0.456 and weighted average of 8.1%, a difference of 50.3%.
Male Unemployment Correlation Summary
| Measurement | Immigrants from Belarus | Alaska Native |
| Minimum | 0.90% | 3.0% |
| Maximum | 15.0% | 62.5% |
| Range | 14.1% | 59.5% |
| Mean | 5.6% | 18.1% |
| Median | 5.1% | 13.6% |
| Interquartile 25% (IQ1) | 4.4% | 7.5% |
| Interquartile 75% (IQ3) | 6.2% | 23.7% |
| Interquartile Range (IQR) | 1.8% | 16.2% |
| Standard Deviation (Sample) | 2.7% | 14.4% |
| Standard Deviation (Population) | 2.7% | 14.3% |
Similar Demographics by Male Unemployment
Demographics Similar to Immigrants from Belarus by Male Unemployment
In terms of male unemployment, the demographic groups most similar to Immigrants from Belarus are Immigrants from Israel (5.4%, a difference of 0.060%), Immigrants from South Eastern Asia (5.4%, a difference of 0.16%), Immigrants from Uganda (5.4%, a difference of 0.20%), Immigrants from South America (5.4%, a difference of 0.24%), and Arab (5.4%, a difference of 0.30%).
| Demographics | Rating | Rank | Male Unemployment |
| Koreans | 34.9 /100 | #185 | Fair 5.3% |
| Iraqis | 31.6 /100 | #186 | Fair 5.4% |
| Costa Ricans | 31.3 /100 | #187 | Fair 5.4% |
| Arabs | 30.2 /100 | #188 | Fair 5.4% |
| Immigrants | South America | 29.4 /100 | #189 | Fair 5.4% |
| Immigrants | Uganda | 28.8 /100 | #190 | Fair 5.4% |
| Immigrants | South Eastern Asia | 28.2 /100 | #191 | Fair 5.4% |
| Immigrants | Belarus | 26.0 /100 | #192 | Fair 5.4% |
| Immigrants | Israel | 25.2 /100 | #193 | Fair 5.4% |
| Spanish | 19.7 /100 | #194 | Poor 5.4% |
| Immigrants | Southern Europe | 17.7 /100 | #195 | Poor 5.4% |
| Albanians | 17.3 /100 | #196 | Poor 5.4% |
| Alsatians | 16.7 /100 | #197 | Poor 5.4% |
| Immigrants | Thailand | 14.7 /100 | #198 | Poor 5.4% |
| Immigrants | Greece | 14.5 /100 | #199 | Poor 5.4% |
Demographics Similar to Alaska Natives by Male Unemployment
In terms of male unemployment, the demographic groups most similar to Alaska Natives are Yakama (7.9%, a difference of 1.9%), Pima (8.3%, a difference of 2.4%), Immigrants from Yemen (7.8%, a difference of 3.7%), Sioux (8.4%, a difference of 3.7%), and Native/Alaskan (7.7%, a difference of 4.7%).
| Demographics | Rating | Rank | Male Unemployment |
| Dominicans | 0.0 /100 | #324 | Tragic 7.6% |
| Shoshone | 0.0 /100 | #325 | Tragic 7.6% |
| Immigrants | Dominican Republic | 0.0 /100 | #326 | Tragic 7.6% |
| Paiute | 0.0 /100 | #327 | Tragic 7.7% |
| Natives/Alaskans | 0.0 /100 | #328 | Tragic 7.7% |
| Immigrants | Yemen | 0.0 /100 | #329 | Tragic 7.8% |
| Yakama | 0.0 /100 | #330 | Tragic 7.9% |
| Alaska Natives | 0.0 /100 | #331 | Tragic 8.1% |
| Pima | 0.0 /100 | #332 | Tragic 8.3% |
| Sioux | 0.0 /100 | #333 | Tragic 8.4% |
| Tsimshian | 0.0 /100 | #334 | Tragic 8.5% |
| Pueblo | 0.0 /100 | #335 | Tragic 8.5% |
| Yuman | 0.0 /100 | #336 | Tragic 8.6% |
| Puerto Ricans | 0.0 /100 | #337 | Tragic 8.6% |
| Apache | 0.0 /100 | #338 | Tragic 8.6% |