Immigrants from the Azores vs Ukrainian Unemployment Among Women with Children Under 6 years
COMPARE
Immigrants from the Azores
Ukrainian
Unemployment Among Women with Children Under 6 years
Unemployment Among Women with Children Under 6 years Comparison
Immigrants from the Azores
Ukrainians
9.2%
UNEMPLOYMENT AMONG WOMEN WITH CHILDREN UNDER 6 YEARS
0.0/ 100
METRIC RATING
312th/ 347
METRIC RANK
7.4%
UNEMPLOYMENT AMONG WOMEN WITH CHILDREN UNDER 6 YEARS
88.2/ 100
METRIC RATING
131st/ 347
METRIC RANK
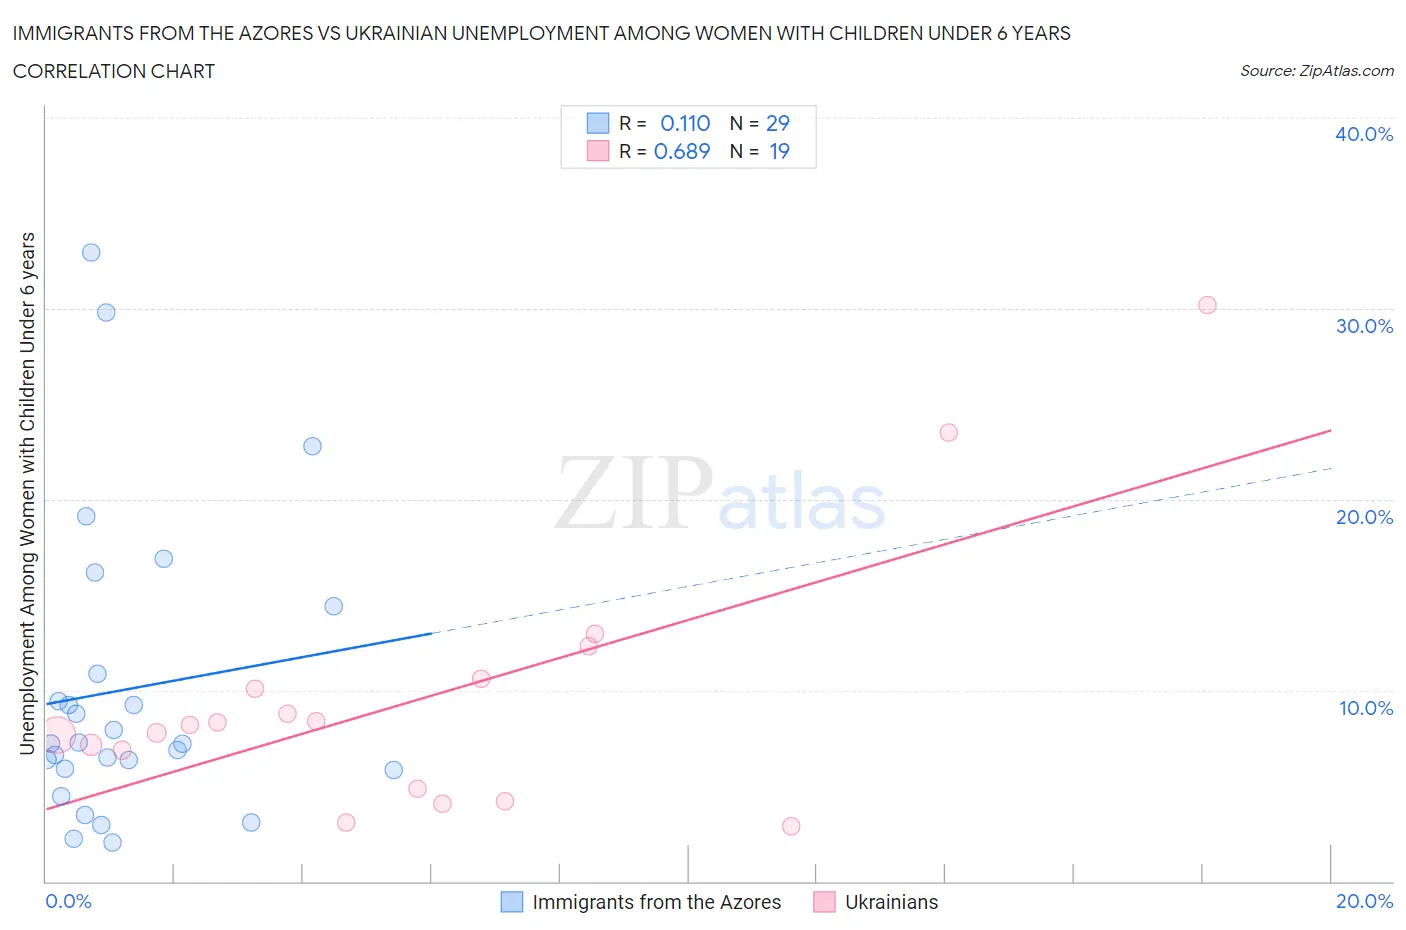
Immigrants from the Azores vs Ukrainian Unemployment Among Women with Children Under 6 years Correlation Chart
The statistical analysis conducted on geographies consisting of 40,648,611 people shows a poor positive correlation between the proportion of Immigrants from the Azores and unemployment rate among women with children under the age of 6 in the United States with a correlation coefficient (R) of 0.110 and weighted average of 9.2%. Similarly, the statistical analysis conducted on geographies consisting of 322,354,784 people shows a significant positive correlation between the proportion of Ukrainians and unemployment rate among women with children under the age of 6 in the United States with a correlation coefficient (R) of 0.689 and weighted average of 7.4%, a difference of 24.7%.
Unemployment Among Women with Children Under 6 years Correlation Summary
| Measurement | Immigrants from the Azores | Ukrainian |
| Minimum | 2.0% | 2.9% |
| Maximum | 32.9% | 30.2% |
| Range | 30.9% | 27.3% |
| Mean | 10.1% | 9.6% |
| Median | 7.2% | 8.2% |
| Interquartile 25% (IQ1) | 5.8% | 4.8% |
| Interquartile 75% (IQ3) | 12.6% | 10.6% |
| Interquartile Range (IQR) | 6.8% | 5.8% |
| Standard Deviation (Sample) | 7.8% | 6.8% |
| Standard Deviation (Population) | 7.6% | 6.6% |
Similar Demographics by Unemployment Among Women with Children Under 6 years
Demographics Similar to Immigrants from the Azores by Unemployment Among Women with Children Under 6 years
In terms of unemployment among women with children under 6 years, the demographic groups most similar to Immigrants from the Azores are French American Indian (9.2%, a difference of 0.14%), Cajun (9.2%, a difference of 0.42%), American (9.3%, a difference of 0.44%), Fijian (9.3%, a difference of 0.46%), and African (9.2%, a difference of 0.55%).
| Demographics | Rating | Rank | Unemployment Among Women with Children Under 6 years |
| Alaskan Athabascans | 0.0 /100 | #305 | Tragic 9.1% |
| Pueblo | 0.0 /100 | #306 | Tragic 9.1% |
| Dominicans | 0.0 /100 | #307 | Tragic 9.1% |
| Immigrants | Micronesia | 0.0 /100 | #308 | Tragic 9.1% |
| Africans | 0.0 /100 | #309 | Tragic 9.2% |
| Cajuns | 0.0 /100 | #310 | Tragic 9.2% |
| French American Indians | 0.0 /100 | #311 | Tragic 9.2% |
| Immigrants | Azores | 0.0 /100 | #312 | Tragic 9.2% |
| Americans | 0.0 /100 | #313 | Tragic 9.3% |
| Fijians | 0.0 /100 | #314 | Tragic 9.3% |
| Cherokee | 0.0 /100 | #315 | Tragic 9.3% |
| Houma | 0.0 /100 | #316 | Tragic 9.4% |
| Dutch West Indians | 0.0 /100 | #317 | Tragic 9.5% |
| Osage | 0.0 /100 | #318 | Tragic 9.5% |
| Marshallese | 0.0 /100 | #319 | Tragic 9.6% |
Demographics Similar to Ukrainians by Unemployment Among Women with Children Under 6 years
In terms of unemployment among women with children under 6 years, the demographic groups most similar to Ukrainians are Swedish (7.4%, a difference of 0.040%), Immigrants from Armenia (7.4%, a difference of 0.13%), Slovene (7.4%, a difference of 0.17%), Immigrants from Uganda (7.4%, a difference of 0.25%), and Immigrants from Bolivia (7.4%, a difference of 0.37%).
| Demographics | Rating | Rank | Unemployment Among Women with Children Under 6 years |
| Immigrants | South Africa | 92.5 /100 | #124 | Exceptional 7.3% |
| Pakistanis | 92.2 /100 | #125 | Exceptional 7.3% |
| Immigrants | Burma/Myanmar | 91.9 /100 | #126 | Exceptional 7.3% |
| Jordanians | 91.5 /100 | #127 | Exceptional 7.3% |
| Zimbabweans | 91.5 /100 | #128 | Exceptional 7.3% |
| Slovenes | 89.2 /100 | #129 | Excellent 7.4% |
| Swedes | 88.4 /100 | #130 | Excellent 7.4% |
| Ukrainians | 88.2 /100 | #131 | Excellent 7.4% |
| Immigrants | Armenia | 87.4 /100 | #132 | Excellent 7.4% |
| Immigrants | Uganda | 86.5 /100 | #133 | Excellent 7.4% |
| Immigrants | Bolivia | 85.7 /100 | #134 | Excellent 7.4% |
| Immigrants | Northern Africa | 85.3 /100 | #135 | Excellent 7.4% |
| Immigrants | Morocco | 84.9 /100 | #136 | Excellent 7.4% |
| Immigrants | Cambodia | 84.6 /100 | #137 | Excellent 7.4% |
| Immigrants | Norway | 84.1 /100 | #138 | Excellent 7.4% |