Immigrants from the Azores vs Ukrainian Female Poverty Among 25-34 Year Olds
COMPARE
Immigrants from the Azores
Ukrainian
Female Poverty Among 25-34 Year Olds
Female Poverty Among 25-34 Year Olds Comparison
Immigrants from the Azores
Ukrainians
15.8%
FEMALE POVERTY AMONG 25-34 YEAR OLDS
0.0/ 100
METRIC RATING
275th/ 347
METRIC RANK
12.6%
FEMALE POVERTY AMONG 25-34 YEAR OLDS
96.7/ 100
METRIC RATING
95th/ 347
METRIC RANK
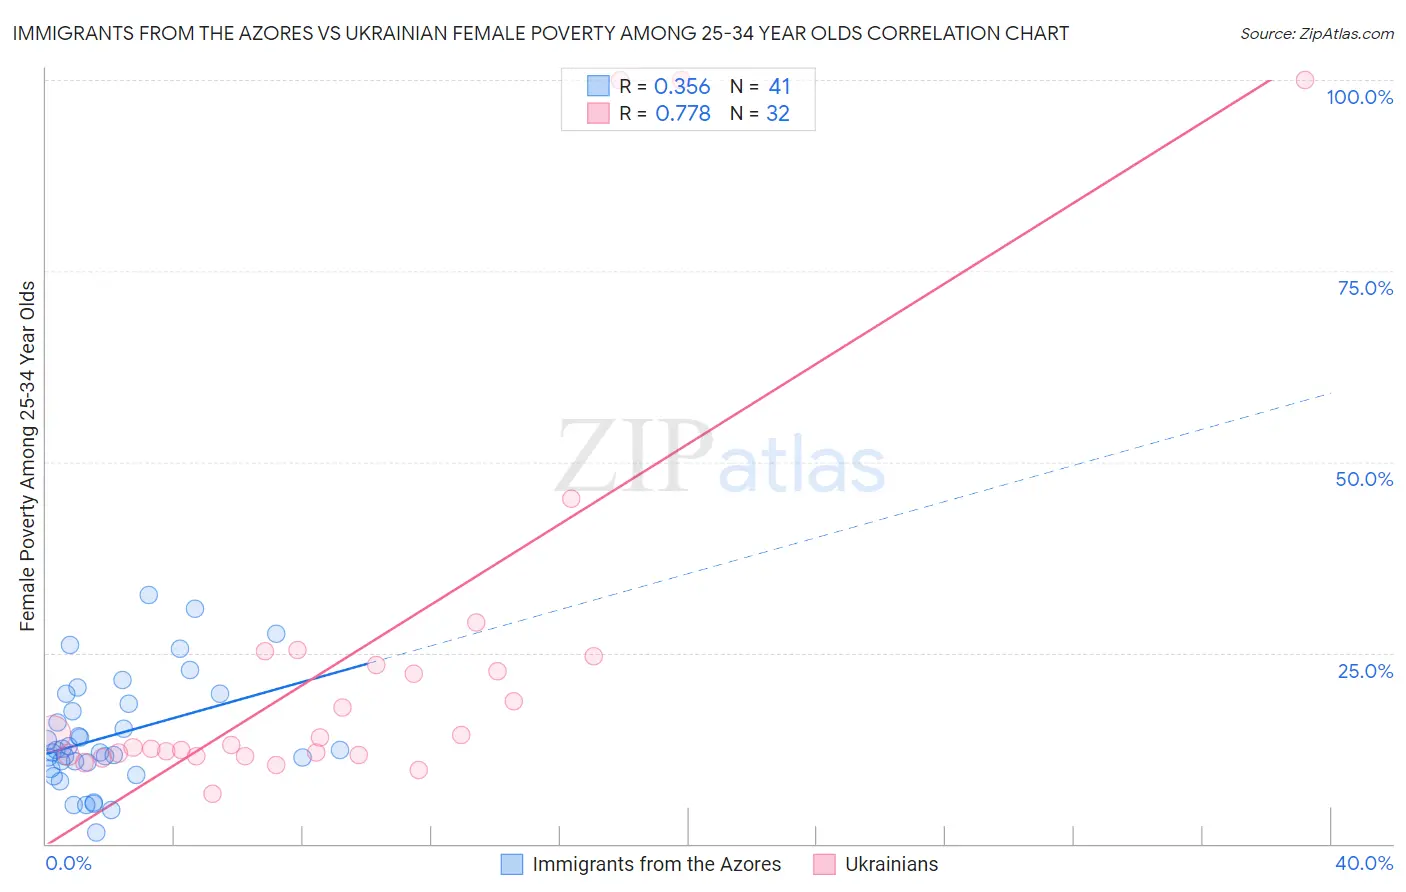
Immigrants from the Azores vs Ukrainian Female Poverty Among 25-34 Year Olds Correlation Chart
The statistical analysis conducted on geographies consisting of 45,939,662 people shows a mild positive correlation between the proportion of Immigrants from the Azores and poverty level among females between the ages 25 and 34 in the United States with a correlation coefficient (R) of 0.356 and weighted average of 15.8%. Similarly, the statistical analysis conducted on geographies consisting of 437,000,334 people shows a strong positive correlation between the proportion of Ukrainians and poverty level among females between the ages 25 and 34 in the United States with a correlation coefficient (R) of 0.778 and weighted average of 12.6%, a difference of 25.4%.
Female Poverty Among 25-34 Year Olds Correlation Summary
| Measurement | Immigrants from the Azores | Ukrainian |
| Minimum | 1.5% | 6.6% |
| Maximum | 32.6% | 100.0% |
| Range | 31.2% | 93.4% |
| Mean | 14.1% | 24.3% |
| Median | 12.2% | 13.4% |
| Interquartile 25% (IQ1) | 10.3% | 11.6% |
| Interquartile 75% (IQ3) | 19.0% | 24.0% |
| Interquartile Range (IQR) | 8.7% | 12.3% |
| Standard Deviation (Sample) | 7.3% | 25.9% |
| Standard Deviation (Population) | 7.2% | 25.5% |
Similar Demographics by Female Poverty Among 25-34 Year Olds
Demographics Similar to Immigrants from the Azores by Female Poverty Among 25-34 Year Olds
In terms of female poverty among 25-34 year olds, the demographic groups most similar to Immigrants from the Azores are Immigrants from Caribbean (15.7%, a difference of 0.35%), Immigrants from Zaire (15.8%, a difference of 0.42%), Immigrants from Micronesia (15.8%, a difference of 0.44%), French American Indian (15.9%, a difference of 0.72%), and Fijian (15.9%, a difference of 0.73%).
| Demographics | Rating | Rank | Female Poverty Among 25-34 Year Olds |
| Immigrants | Senegal | 0.1 /100 | #268 | Tragic 15.6% |
| Sub-Saharan Africans | 0.1 /100 | #269 | Tragic 15.6% |
| British West Indians | 0.1 /100 | #270 | Tragic 15.6% |
| Cree | 0.1 /100 | #271 | Tragic 15.6% |
| Senegalese | 0.1 /100 | #272 | Tragic 15.6% |
| Immigrants | Nonimmigrants | 0.1 /100 | #273 | Tragic 15.6% |
| Immigrants | Caribbean | 0.0 /100 | #274 | Tragic 15.7% |
| Immigrants | Azores | 0.0 /100 | #275 | Tragic 15.8% |
| Immigrants | Zaire | 0.0 /100 | #276 | Tragic 15.8% |
| Immigrants | Micronesia | 0.0 /100 | #277 | Tragic 15.8% |
| French American Indians | 0.0 /100 | #278 | Tragic 15.9% |
| Fijians | 0.0 /100 | #279 | Tragic 15.9% |
| Bangladeshis | 0.0 /100 | #280 | Tragic 15.9% |
| Immigrants | Latin America | 0.0 /100 | #281 | Tragic 16.0% |
| Aleuts | 0.0 /100 | #282 | Tragic 16.1% |
Demographics Similar to Ukrainians by Female Poverty Among 25-34 Year Olds
In terms of female poverty among 25-34 year olds, the demographic groups most similar to Ukrainians are Immigrants from Zimbabwe (12.6%, a difference of 0.010%), Immigrants from France (12.6%, a difference of 0.040%), Palestinian (12.6%, a difference of 0.090%), Immigrants from Armenia (12.6%, a difference of 0.12%), and Norwegian (12.6%, a difference of 0.13%).
| Demographics | Rating | Rank | Female Poverty Among 25-34 Year Olds |
| Immigrants | Austria | 97.4 /100 | #88 | Exceptional 12.5% |
| Italians | 97.2 /100 | #89 | Exceptional 12.5% |
| Immigrants | Albania | 97.1 /100 | #90 | Exceptional 12.5% |
| Norwegians | 96.9 /100 | #91 | Exceptional 12.6% |
| Immigrants | Armenia | 96.9 /100 | #92 | Exceptional 12.6% |
| Palestinians | 96.9 /100 | #93 | Exceptional 12.6% |
| Immigrants | France | 96.8 /100 | #94 | Exceptional 12.6% |
| Ukrainians | 96.7 /100 | #95 | Exceptional 12.6% |
| Immigrants | Zimbabwe | 96.7 /100 | #96 | Exceptional 12.6% |
| Immigrants | Northern Africa | 96.6 /100 | #97 | Exceptional 12.6% |
| Immigrants | Ethiopia | 96.5 /100 | #98 | Exceptional 12.6% |
| Immigrants | Argentina | 96.4 /100 | #99 | Exceptional 12.6% |
| Immigrants | Denmark | 95.7 /100 | #100 | Exceptional 12.7% |
| Immigrants | Switzerland | 95.7 /100 | #101 | Exceptional 12.7% |
| Peruvians | 95.6 /100 | #102 | Exceptional 12.7% |