Zimbabwean vs Ukrainian Unemployment Among Women with Children Under 6 years
COMPARE
Zimbabwean
Ukrainian
Unemployment Among Women with Children Under 6 years
Unemployment Among Women with Children Under 6 years Comparison
Zimbabweans
Ukrainians
7.3%
UNEMPLOYMENT AMONG WOMEN WITH CHILDREN UNDER 6 YEARS
91.5/ 100
METRIC RATING
128th/ 347
METRIC RANK
7.4%
UNEMPLOYMENT AMONG WOMEN WITH CHILDREN UNDER 6 YEARS
88.2/ 100
METRIC RATING
131st/ 347
METRIC RANK
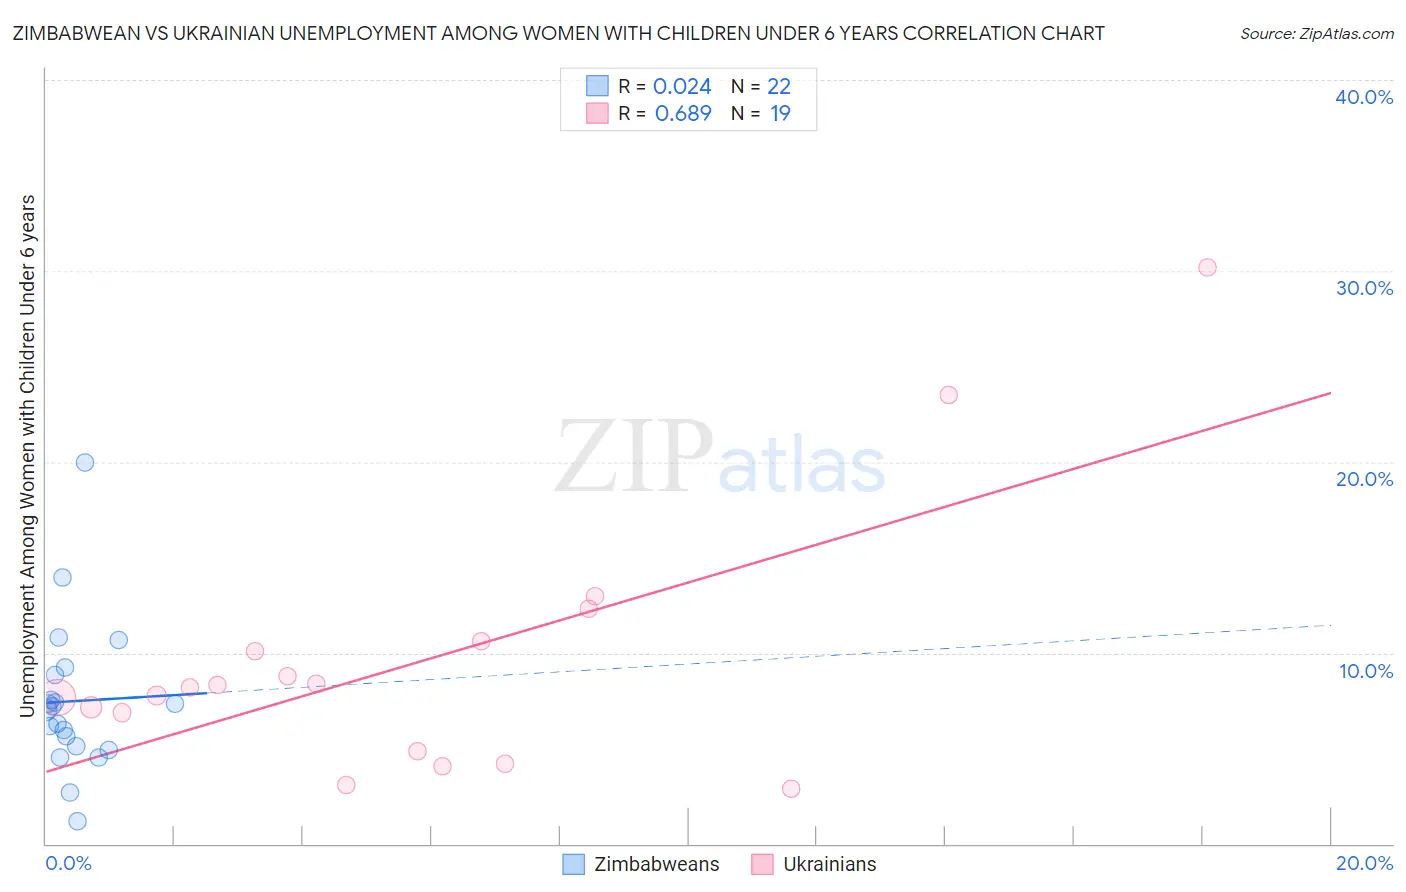
Zimbabwean vs Ukrainian Unemployment Among Women with Children Under 6 years Correlation Chart
The statistical analysis conducted on geographies consisting of 63,906,622 people shows no correlation between the proportion of Zimbabweans and unemployment rate among women with children under the age of 6 in the United States with a correlation coefficient (R) of 0.024 and weighted average of 7.3%. Similarly, the statistical analysis conducted on geographies consisting of 322,354,784 people shows a significant positive correlation between the proportion of Ukrainians and unemployment rate among women with children under the age of 6 in the United States with a correlation coefficient (R) of 0.689 and weighted average of 7.4%, a difference of 0.62%.
Unemployment Among Women with Children Under 6 years Correlation Summary
| Measurement | Zimbabwean | Ukrainian |
| Minimum | 1.2% | 2.9% |
| Maximum | 20.0% | 30.2% |
| Range | 18.8% | 27.3% |
| Mean | 7.5% | 9.6% |
| Median | 7.1% | 8.2% |
| Interquartile 25% (IQ1) | 5.1% | 4.8% |
| Interquartile 75% (IQ3) | 8.9% | 10.6% |
| Interquartile Range (IQR) | 3.7% | 5.8% |
| Standard Deviation (Sample) | 3.9% | 6.8% |
| Standard Deviation (Population) | 3.9% | 6.6% |
Demographics Similar to Zimbabweans and Ukrainians by Unemployment Among Women with Children Under 6 years
In terms of unemployment among women with children under 6 years, the demographic groups most similar to Zimbabweans are Jordanian (7.3%, a difference of 0.0%), Immigrants from Burma/Myanmar (7.3%, a difference of 0.10%), Pakistani (7.3%, a difference of 0.17%), Immigrants from South Africa (7.3%, a difference of 0.25%), and Immigrants from Zaire (7.3%, a difference of 0.45%). Similarly, the demographic groups most similar to Ukrainians are Swedish (7.4%, a difference of 0.040%), Immigrants from Armenia (7.4%, a difference of 0.13%), Slovene (7.4%, a difference of 0.17%), Immigrants from Uganda (7.4%, a difference of 0.25%), and Immigrants from Bolivia (7.4%, a difference of 0.37%).
| Demographics | Rating | Rank | Unemployment Among Women with Children Under 6 years |
| South Africans | 94.1 /100 | #119 | Exceptional 7.3% |
| Iraqis | 93.9 /100 | #120 | Exceptional 7.3% |
| Immigrants | Chile | 93.5 /100 | #121 | Exceptional 7.3% |
| Immigrants | Bosnia and Herzegovina | 93.5 /100 | #122 | Exceptional 7.3% |
| Immigrants | Zaire | 93.3 /100 | #123 | Exceptional 7.3% |
| Immigrants | South Africa | 92.5 /100 | #124 | Exceptional 7.3% |
| Pakistanis | 92.2 /100 | #125 | Exceptional 7.3% |
| Immigrants | Burma/Myanmar | 91.9 /100 | #126 | Exceptional 7.3% |
| Jordanians | 91.5 /100 | #127 | Exceptional 7.3% |
| Zimbabweans | 91.5 /100 | #128 | Exceptional 7.3% |
| Slovenes | 89.2 /100 | #129 | Excellent 7.4% |
| Swedes | 88.4 /100 | #130 | Excellent 7.4% |
| Ukrainians | 88.2 /100 | #131 | Excellent 7.4% |
| Immigrants | Armenia | 87.4 /100 | #132 | Excellent 7.4% |
| Immigrants | Uganda | 86.5 /100 | #133 | Excellent 7.4% |
| Immigrants | Bolivia | 85.7 /100 | #134 | Excellent 7.4% |
| Immigrants | Northern Africa | 85.3 /100 | #135 | Excellent 7.4% |
| Immigrants | Morocco | 84.9 /100 | #136 | Excellent 7.4% |
| Immigrants | Cambodia | 84.6 /100 | #137 | Excellent 7.4% |
| Immigrants | Norway | 84.1 /100 | #138 | Excellent 7.4% |
| Immigrants | Colombia | 83.9 /100 | #139 | Excellent 7.4% |